To infinity and beyond – displaying huge numbers in Grafana
If you want to display a huge number, lets say 6 digits or more, showing the full number does not look very good and takes too much space. Here is a quick tip on how to show these bigger numbers in a more concise format.
Single stat panel with a huge number
By default if you show a number in Grafana, for example using the single stat panel, it prints the full number. If you show data in a higher range than this can get crowded quite quickly. I ran into this issue when I wanted to show the number of DNS queries send to my Adguard Home ad blocker. I recently set up a second instance for reliability and wanted to compare both.

Said and done. I just created two single stat panels, each showing the number of requests going to one of the instances with the “number” unit type. Unfortunately my main instance gets quite a big number of requests, in the 6 digit range for a week. Showing 390439 requests works but that’s a higher level of detail than I need and also not easy to quickly parse when scanning the whole dashboard.
If you are looking for an even better shortcut in your smart home journey check out my new Grafana & Home Assistant guide here!
It contains all the information from this article and much more. Images, code and a full step by step guide on how to use Grafana and integrate it with Home Assistant – for beautiful and functional dashboards!
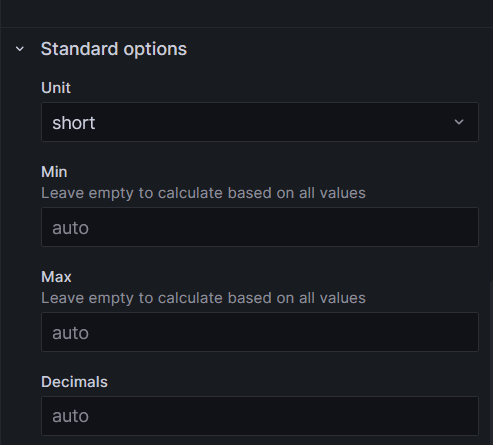
Shortening numbers with the short unit type
I set up the panel with the “number” unit by default because – well that’s what I want to show, right? Nope, there is actually a better way. If you switch to the “short” unit instead then it will automatically use abbreviations like 390k instead of the full number 390439.
In the end with a couple of minutes of work I have another nice addition to my dashboard: it is now showing the number of requests going to both DNS ad blocker instances as well as their percentage compare. This way I can easily spot errors with one of the instances by seeing traffic switch to the second one.

It is a very simple change but helps a lot building a clean dashboard. If you are looking for more information about Grafana then read my articles on how to build great Grafana dashboards, how to add them to Home Assistant or how to make them more dynamic.