How to build a dynamic dashboard in Grafana
Grafana is an awesome tool to visualize your smart home data. It gets even better if you create a dynamic dashboard though. Change the datasource for a set of diagrams with one click – easy, show all values of a certain type in one diagram? – possible! All of this can be done with variables in Grafana.
If you are looking for an even better shortcut in your smart home journey check out my new Grafana & Home Assistant guide V2 here!
It contains all the information from this article and much more. Images, code and a full step by step guide on how to use Grafana and integrate it with Home Assistant – for beautiful and functional dashboards!
How static dashboards in Grafana work
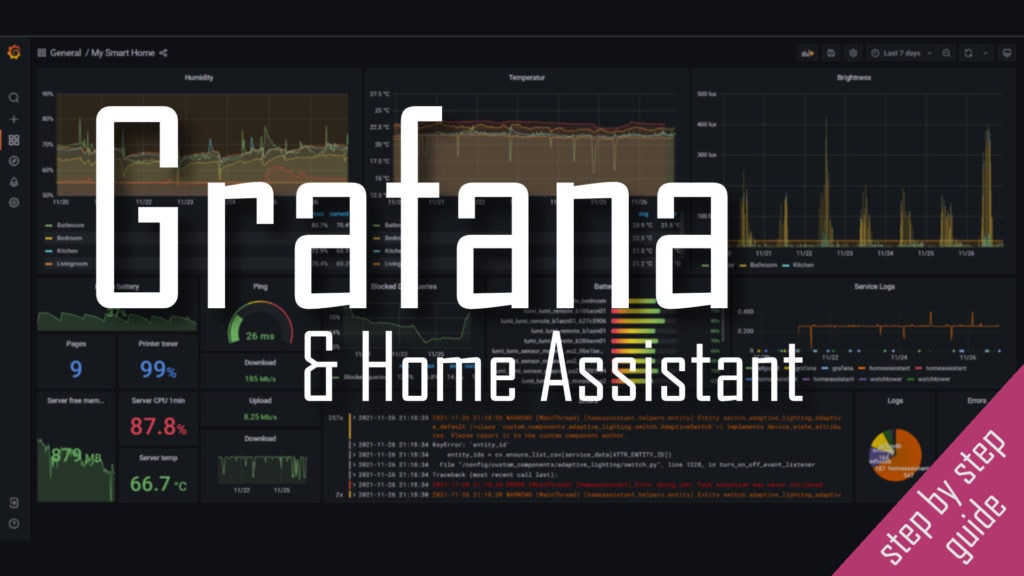
First of all Grafana is an awesome tool to visualize all kinds of data. I used it with Home Asssistant to display home data (like temperatures of time) and event to view my logs. It can visualize all the data that I pushed to InfluxDB and Loki. This is a great tool already but it works on a set of “static” diagrams. While you can change the timescale you can not easily change the data source.

This means a diagram set up to show the temperature in one room will always do so. Sounds good right? It actually is most of the time, but sometimes you want more flexibility. If you have a set of diagrams that repeat for each room for example you might not want to duplicate them. Having a separate diagram with temperature data for each rooms quickly clutters up the dashboard.
Even if you have only one diagram showing all the rooms together you still need to manually update this every time you add a new sensor. If only there was a way to make this simpler…
How to add variables to Grafana
One way to add dynamic data to Grafana is by using variables. You can create a set of variables that can then be used in each diagram. The value of the variable can be changed, either automatically or manually with a drop-down menu. This allows for more dynamic dashboards.
Creating variables in Grafana is simple. First you need to go to the dashboard settings by using the menu bar at the top. You will get to the settings by clicking the small gear icon. Do not use the gear icon in the left side bar, those are the settings for the full Grafana instance.

Once you are in the settings go to the variables section.

You will see a list of all variables you already added and a “New” to add more. Variables can be of different types like query, text, datasource or some others. For our usecases we only need queries. In general these variables hold data that can change under certain conditions and can later be used as a placeholder for this data in graphs. Too abstract? Here are some examples.
How to use variables
We can safe the result of a query in the variable and use it in another query in the actual graph. By default all variables will be shown as small drop-down menus at the top of the dashboard so that you can select their current value.

Afterwards you can use this value in a panel source as a placeholder. This is done by adding a $ sign in front of the variable name. In the following example I actually used three variables: my custom battery_entities selector to select the entities (controlled by the drop-down menu) and the default __interval and $timeFilter variables created by Grafana that represent the current time selection on the dashboard.

These variables can be pretty powerful and you can use for some neat tricks.
Variables for changing data sources
Variables can be used to display data for different selections. I have one diagram displaying all my rooms’ temperatures. This works but adds a lot of data to one diagram. I also have the same thing for humidity and brightness values.
Instead I could combine all three values into one diagram and make the actual room a variable. By switching the variable via a drop-down menu we can then select which room to display the data for. To do this we simply need to run a query to get all available sensors. In my case all the temperature sensors are called something including lumi_weather and end in _temperature. We can use this to write a query for InfluxDB like
show measurements WITH MEASUREMENT =~ /lumi_weather.*_temperature/This will load all measurement (something like tables in InfluxDB, each sensor gets its own) that match a certain string (=~) which we build to start with the weather part, followed by anything (*) and end with the temperature. This will returns all kinds of sensors where the names follow this schema. Therefore it is important to follow a naming schema in Home Assistant (which is pushing this data to InfluxDB).
We can then use the variable in the query builder for any panel. Like this you can easily use it as a placeholder.

This way with the click of one button we can reuse the same diagram for different rooms, effectively changing the source of data for an existing diagram.
Variables for dynamic diagrams
Variables can be used to show the same data for different selections but there is an even better usage in my opinion: building dynamic diagrams that automatically include all relevant data. For example I track the battery status of all my battery powered devices in Home Assistant. I even built an automated low battery warning system.
I was also looking to visualize this data in Grafana, so I created a new bar graph and added all my devices at that time. Unfortunately I regularly add new ones and often forget to add them here in Grafana too. After some time it gets really complicated to track which devices are missing and which are already added. Instead I was looking for a way to automatically add all battery devices to the diagram.
This can be done using variables. I added a new query that finds all my battery powered devices by name. They are all sensors that end with _power. Knowing that it is easy to create another query variable.
show measurements WITH MEASUREMENT =~ /sensor.*_power/I decided to hide the variable (as I will always select all) and enable the “All” option. I am always looking to see all my devices at the same time. I also decided that the variable needs to only update on a dashboard load.

Below the variable settings Grafana will show you a preview of some values matching your query. A good way to double check it. Now this variable can be used to create a bar graph. It will get the data for all selected sensors – so by default all of them.
Now these sensors have a very long name including the _power part wich makes the result a bit ugly. To fix this issue I used a transformation. Transformations are used to change the loaded data in some way. In this case I used it to remove some of the unneeded parts of the entity names.

This transformation uses a regular expression which makes it a bit complicated to create. You can use online tools to check your syntax. My regex sensor.(.*)_power.mean is building a group containing everything between the sensor prefix and the _power suffix. The result is stored in group 1 which I use in the replace field by referencing it via $1.

Using all of that I finally get a nice bar graph. Sure most of the names are still unreadable (because I did not follow my own advice and failed to properly rename my sensors in Home Assistant) but others like blinds_bedroom are easy to identify. The best part about it is that this diagram will automatically update to include any future battery powered device I might add to my system!
Using this I can see all the batteries I need to change (my water leak sensor and my blinds) instantly when I open my dashboard. Pretty neat!