Simplifying log aggregation for Docker containers – how to easily set up Loki & Grafana
Running a lot of Docker containers for your smart home and other software needs generates a lot of logs. A simple tool for log aggregation to view all of them together can help a lot. Professional software like the ELK stack is complicated to set up but there is a simpler alternative: Loki. A simple tools that allows you to view all your logs with another great software you should already be using: Grafana. Here is how to get started.
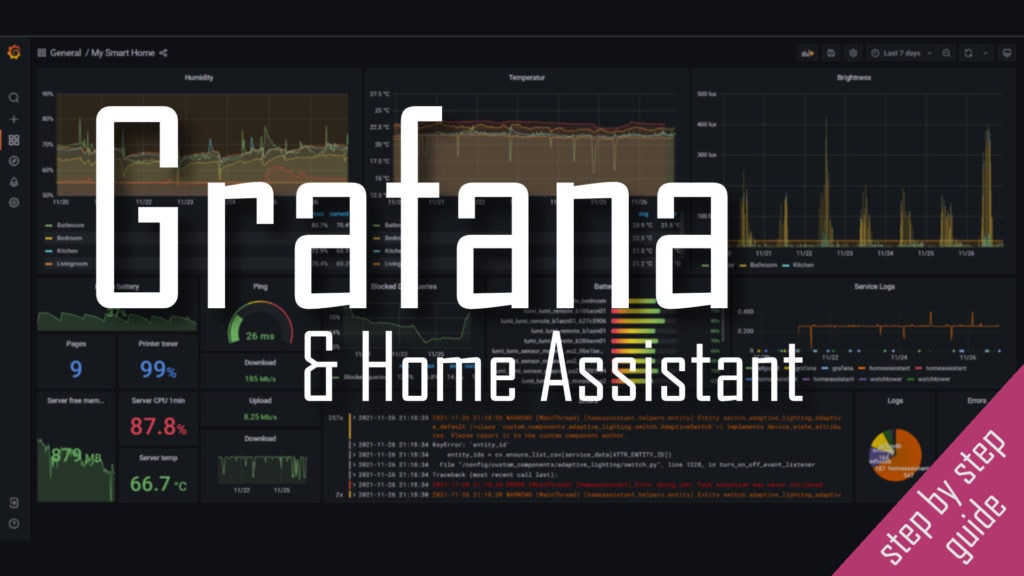
If you are looking for an even better shortcut in your smart home journey check out my new Grafana & Home Assistant guide here!
It contains all the information from this article and much more. Images, code and a full step by step guide on how to use Grafana and integrate it with Home Assistant – for beautiful and functional dashboards!
Loki & Grafana – log aggregation
If you run Docker container you might have to check their log output to see what they are doing and especially to be able to detect and fix errors. This can be done by using docker logs containername from the host. If you are running a more complex setup like my smart home server you will be running more than one container at a time though. Checking every single one gets boring soon so you can use docker-compose -f composefile.yml logs to check all logs from one compose file at the same time.
This can still get confusing fast with a huge amount of logs. If you are also running multiple compose files at the same time like I do the situation gets even worse. This is where log aggregation systems come in handy: they collect logs from different places and give you a unified interfaces to go through them. This usually includes filtering options which can come in very handy.
A professional and very powerful stack for this is called ELK. ElasticSearch, Logstash and Kibana and great tools to aggregate logs, make them searchable and give a powerful tool to search through them. I use this system regularly for software development and have deployed it on another server before. The problem is that while it is very powerful it is also a bit more complicated to use and set up properly.

Fortunately the makers of the awesome visualization tool Grafana (I use it for my smart home a lot) have a simpler tool for this usecase: Loki. It is open source and free to use for personal projects, the same as Grafana. Installation is quite simple via Docker and it uses the known user interface of Grafana to show you the logs.
Installation of Loki
If you already run a Docker (compose) based server the installation of Loki and Grafana is pretty simple. You can either just use my smart home server setup (GitHub) with all the code or add this to the hosting.yml file:
loki:
    container_name: loki
    image: grafana/loki:2.3.0
    restart: unless-stopped
    ports:
      - "127.0.0.1:3100:3100"
    volumes:
      - ${DATADIR}/loki/config/loki-config.yaml:/etc/loki/loki-config.yaml
      - ${DATADIR}/loki/data:/data/loki
    command: -config.file=/etc/loki/loki-config.yaml
You will also need a loki-config.yaml file that we provide to the loki container. I copied mine from here, you can also find it in my Github repo. It is basically a set of standard settings that I did not change.
# (default configuration)
auth_enabled: false

server:
  http_listen_port: 3100

ingester:
  lifecycler:
    address: 127.0.0.1
    ring:
      kvstore:
        store: inmemory
      replication_factor: 1
    final_sleep: 0s
  chunk_idle_period: 1h       # Any chunk not receiving new logs in this time will be flushed
  max_chunk_age: 1h           # All chunks will be flushed when they hit this age, default is 1h
  chunk_target_size: 1048576  # Loki will attempt to build chunks up to 1.5MB, flushing first if chunk_idle_period or max_chunk_age is reached first
  chunk_retain_period: 30s    # Must be greater than index read cache TTL if using an index cache (Default index read cache TTL is 5m)
  max_transfer_retries: 0     # Chunk transfers disabled

schema_config:
  configs:
    - from: 2020-10-24
      store: boltdb-shipper
      object_store: filesystem
      schema: v11
      index:
        prefix: index_
        period: 24h

storage_config:
  boltdb_shipper:
    active_index_directory: /loki/boltdb-shipper-active
    cache_location: /loki/boltdb-shipper-cache
    cache_ttl: 24h         # Can be increased for faster performance over longer query periods, uses more disk space
    shared_store: filesystem
  filesystem:
    directory: /loki/chunks

compactor:
  working_directory: /loki/boltdb-shipper-compactor
  shared_store: filesystem

limits_config:
  reject_old_samples: true
  reject_old_samples_max_age: 168h
  ingestion_burst_size_mb: 16
  ingestion_rate_mb: 16

chunk_store_config:
  max_look_back_period: 0s

table_manager:
  retention_deletes_enabled: false
  retention_period: 0s

ruler:
  storage:
    type: local
    local:
      directory: /loki/rules
  rule_path: /loki/rules-temp
  alertmanager_url: localhost
  ring:
    kvstore:
      store: inmemory
  enable_api: true
If you are not already using Grafana anyways (I have it in my smarthome.yml file) you can also add it like this:
grafana:
    image: "grafana/grafana:latest"
    restart: unless-stopped
    user: "0"
    volumes:
      - "${DATADIR}/grafana/data:/var/lib/grafana"
    ports:
      - 3000:3000
    environment:
      - GF_AUTH_DISABLE_LOGIN_FORM=true
      - GF_AUTH_ANONYMOUS_ENABLED=true
      - GF_AUTH_ANONYMOUS_ORG_ROLE=Admin
      - GF_SECURITY_ALLOW_EMBEDDING=true
The environment variables are needed for Grafana integration in Home Assistant. If that is not needed remove them for a slightly more secure setup.
You can also just download my full repository. Then just start up your containers via docker-compose -f file.yml up -d.
Pushing logs to Loki
Loki only aggregates logs and makes them searchable. It does not find the logs automatically. Instead you need to push them to Loki. There are two main solutions here. Either another service called promtail or a custom docker logging driver.
Promtail
Promtail is an agent that can run on your system, read any kind of log files and send them Loki. While doing that it can also analyse the files and add so called tags to each entry. That can be the log level for example (usually INFO/WARN/ERROR…). This can be done quite easily with docker too. Just add this to your compose file:
promtail:
  container_name: promtail
  image: grafana/promtail:2.3.0
  restart: unless-stopped
  volumes:
    - /var/lib/docker/containers:/var/lib/docker/containers:ro
    - ${DATADIR}/promtail/config/promtail-config.yaml:/etc/promtail/promtail-config.ya
  command: -config.file=/etc/promtail/promtail-config.yaml
This will need another configuration file – promtail-config.yaml – which points it to the log files. I used this
server:
  http_listen_port: 9080
  grpc_listen_port: 0

positions:
  filename: /tmp/positions.yaml

clients:
  - url: http://loki:3100/loki/api/v1/push

scrape_configs:
- job_name: containers
  static_configs:
  - targets:
      - localhost
    labels:
      job: containerlogs
      __path__: /var/lib/docker/containers/*/*log

  pipeline_stages:
  - json:
      expressions:
        output: log
        stream: stream
        attrs:
  - json:
      expressions:
        tag:
      source: attrs
  - regex:
      expression: (?P<image_name>(?:[^|]*[^|])).(?P<container_name>(?:[^|]*[^|])).(?P<image_id>(?:[^|]*[^|])).(?P<container_id>(?:[^|]*[^|]))
      source: tag
  - timestamp:
      format: RFC3339Nano
      source: time
  - labels:
      tag:
      stream:
      image_name:
      container_name:
      image_id:
      container_id:
  - output:
      source: output
It will read all docker container logs (usually found in /var/lib/docker/containers/*/*log) and send them to loki. As the container is called loki in the compose file and is running on the same network it is reachable via http://loki:3100. If this is different for you, you need to update these settings. This file also adds some tags that can later be used in Grafana to separate logs from different services.
While this is very flexible, as you can read all kinds of logs files, I found it less than perfect for Docker containers. The log files are just names after the container id -some random string- so you can not easily identify the containers in Grafana later.
Loki logging driver
The second solution is using a custom logging driver. Usually Docker uses the json logging driver to just write container logs as JSON to the files we used earlier with promtail. Instead we can switch (for each container) to using a custom logging driver that directly sends these logs to Loki.
Installation of that driver is quite easy but there was a slight catch if you are running it on a Raspberry Pi. On a x64 CPU it works like this:
docker plugin install grafana/loki-docker-driver:latest --alias loki --grant-all-permissionsHowever this does not support the ARM processor the Raspberry Pi is using. For my Raspberry Pi 4 this worked instead:
docker plugin install grafana/loki-docker-driver:arm-v7 --alias loki --grant-all-permissions
Afterwards you can check with docker plugin ls to see if the plugin is ready and enabled. Now you could either change the settings for all containers or, like I did, set the driver for every single container. That way you adapt each container to your liking. I decided to switch all the important containers to using the Loki driver by adding this logging code to the docker-compose files. Here is an example for my watchtower container will start sending its logs to Loki.
watchtower:
    container_name: watchtower
    image: containrrr/watchtower
    volumes:
      - /var/run/docker.sock:/var/run/docker.sock
    environment:
      - TZ=${TZ}
      - WATCHTOWER_CLEANUP=true
      - WATCHTOWER_NOTIFICATIONS=shoutrrr
      - WATCHTOWER_NOTIFICATION_URL=pushover://shoutrrr:${PO_TOKEN}@${PO_USERKEY}
    logging:
      driver: loki
      options:
        loki-url: "http://localhost:3100/loki/api/v1/push"
The same can be done for other containers like Home Assistant. Just add the logging section to each container. Afterwards you will not be able to see this containers logs via docker-compose anymore but you now have a more powerful solution: Loki & Grafana.
PS Loki writes logs into a json file for each service. By default those files have no size restriction and can get quite big! I added a size limit and some more explanation in this post.
Viewing the logs in Grafana
Now that the logs are being pushed to Loki it is time to open your Grafana instance and connect it to Loki. Open http://yourServerIp:3000/ and log in if that is not disabled. Then go to configuration - datasources to add Loki.

The configuration for the new datasource is pretty simple: just provide a name and the URL. If the containers are on the same network you can use the container name. In my case that means that http://loki:3100 works. Click save & test to check if you configuration works.

Now we can start using that new data source to check our service logs. Go to the explore section in the menu and select the new Loki data source in the drop down menu.
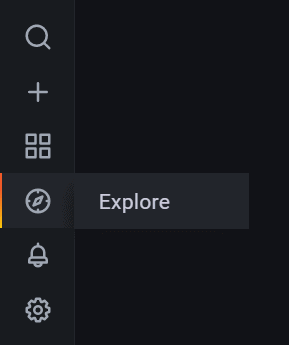
A click on the “Log browser” button will show you all the available logs.

Here you can use the “compose_project” label to select all your services or use single “compose_service” tags to just view the logs for a certain set of services.

Select some of them and click the “Show logs” button to show the actual logs. You will see a diagram showing the amount of logs and the list of actual logs below. You can still use the timepicker at the top right of your screen to select a certain timeframe. You can also use the new “Live” button here to see logs as soon as they are received by Loki.
Clicking on a single log entry will show you more details about it. You can also always go back to the log browser to update your search query. For example instead of showing the actual logs you can also show the rate of certain logs coming in. This is where using Grafana to view the logs comes in really handy: you can also add all of these information to your existing smart home dashboard!
Adding logs to your dashboard
If you follow my blog you know that I created a Grafana dashboard to get a quick overview of my full smart home. It is even integrated directly into Home Assistant. Now the same dashboard can be used to show information about the logs.

As you can see I slightly updated this dashboard now to include information about my logs. There is a big panel at the bottom that is showing the most recent errors from all of my services, and there is a smaller panel above it that shows the rate of logs being produced. Spikes here will usually hint at some kind of problem.
Setting these up is pretty simple. For the error list I used the “Logs” panel with these settings. I selected my most important containers (adguard ad blocker, watchtower for docker updates and Home Assistant). As a source I selected the “stderr” for only errors. The legend is set to display the service name for each container.

The service log rates are set up in a similar way. I used a “Time series” panel with these settings. This time I selected all services and the rate. The legend settings are the same as before.

Overall I think this setup is great for a simple (smart home) server. It is easy to set up Loki and Promtail or a custom logging driver with the help of Docker. Using these logs from Grafana is also really simple, especially if you are already familiar with Grafana. Being able to integrate this information with your (existing) Grafana dashboards is just the cherry on the cake.
For me this is a great compromise between easy to set up and still a very powerful tool. If you are not already very familiar with more complicated tools like the ELK stack or willing to use an online service (which you most likely have to pay for) this is the best solution I have found so far.