How to seamlessly add Grafana graphs to Home Assistant
Home Assistant dashboard are great, but Grafana is even more powerful. So why not combine them and embed your Grafana graphs directly into your Home Assistant dashboard? It is actually pretty simple.
If you are looking for an even better shortcut in your smart home journey check out my new Grafana & Home Assistant guide V2 here!
It contains all the information from this article and much more. Images, code and a full step by step guide on how to use Grafana and integrate it with Home Assistant – for beautiful and functional dashboards!
How to push your Home Assistant data into Grafana
To get your data from Home Assistant to Grafana you first need to combine both. I described this in depth in this article. Basically you can tell Home Assistant to also save all its data in a separate InfluxDB database and then read that data from Grafana. Grafana is a great tool to build beautiful looking and very informative graphs from that data and to drill down into any part of it.

While Home Assistant also offers build-in data visualization tools they are not as powerful nor as good looking (without more customization). You can of course add pretty much everything you want via HACS but you can also just use Grafana as one single and powerful tool.
Preparing Grafana for sharing
To simply embed Grafana elements somewhere else (Home Assistant in our case) you need to first disable some security measurements. Usually you can only Grafana data when you are logged in. That is definitely important for bigger networks or public instances but in my case Grafana is only available inside my own network so I do not think I really need access control here.
Grafana settings can be edited in the Grafana configuration, which can be a file or in case of a Docker installation environment variables. On my custom smart home server the software, including Grafana, InfluxDB and Home Assistant) runs in Docker containers managed by docker-compose. I can really recommend this setup as changing settings like this only means adding a couple of lines and restarting one container.
As always you can find all the code in my GitHub repository for my smart home server. Go to the Grafana container (in my case in the smarthome.yml file) and add a couple of new environment variables.
environment:
       - GF_AUTH_DISABLE_LOGIN_FORM=true
       - GF_AUTH_ANONYMOUS_ENABLED=true
       - GF_AUTH_ANONYMOUS_ORG_ROLE=Admin
       - GF_SECURITY_ALLOW_EMBEDDING=true
This will allow you to access your Grafana dashboards without having to log in and disables a security measure that prevents you from using Grafana in an iframe (basically a website in a website). Then just restart your Grafana container via docker-compose -f smarthome.yml up -d Now we can include Grafana in Home Assistant dashboards.
How to include single Grafana panels in a Home Assistant dashboard
After the previously explained changes you can now very easily add single panels to your Home Assistant dashboard. Just go to your Grafana panel, click on the title and select share.

In the menu that pops up you can switch to the Embed tab and copy the src URL part from the text box. Before you do that you can also switch of the current time range slider above. That way the timeframe for the Grafana data shown in the diagram will automatically keep updating.

Now you can go back to your Home Assistant dashboard and add a new webpage card to your dashboard.

Enter the URL copied from Grafana and click close. You should now see this diagram in your dashboard! Of course you can repeat the process to add more.

How to add a full Grafana dashboard to Home Assistant
You can not only add single panels from Grafana but you can also include a full Grafana dashboard in Home Assistant. Go to the dashboard in Grafana and click the share icon next to the title.

Disable the lock timerange and copy the link. I personally also added &kiosk=tv to the URL to get rid of the side menu.

Then go back to Home Assistant and create a new tab in your dashboard. Enable the panel mode to make your Grafana panel use the full space and give it a title. (Update: this is now called “View type” in newer HA versions. Select “Panel (1 card)” here). Then add one webpage card and paste the link from above.
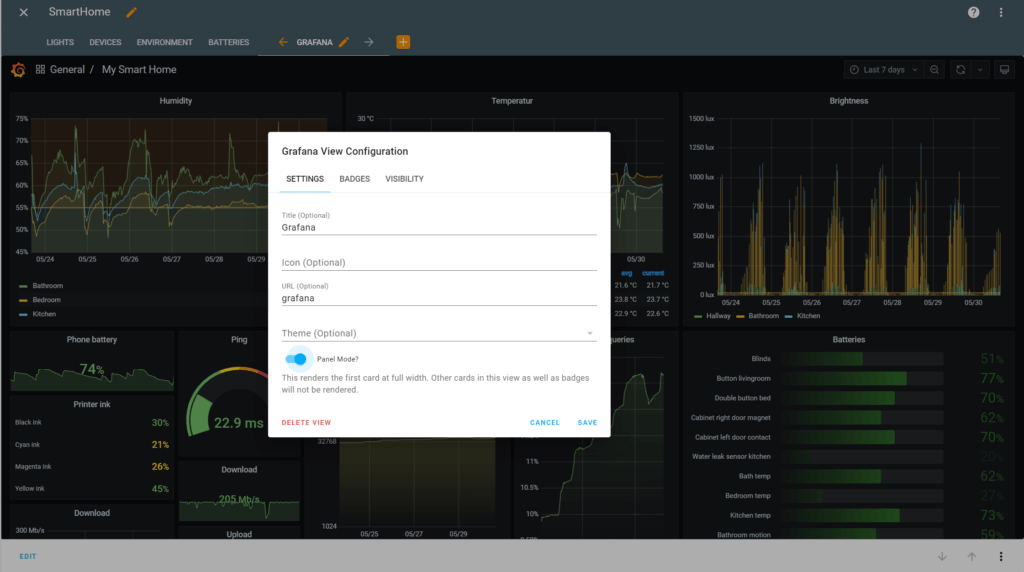
Now you have a tab in your dashboard that includes the full Grafana screen including the box at the top that allows you to change timeframes. You can also still switch very quickly back to your other tabs to control your devices. Pretty awesome! The only disadvantage is that it takes a small moment to load the Grafana elements after you open the tab. As it is all within your network it should load really fast though.