Beautiful dashboards for your smart home with InfluxDB, Grafana and Home Assistant
Home Assistant is awesome but it lacks advanced support for showing data, especially over time. There is a much better software for this: Grafana. And it can easily be integrated with Home Assistant. I set up InfluxDB and Grafana with my Home Assistant installation and will show you how to do this in no time in this blog post.
If you are looking for an even better shortcut in your smart home journey check out my new Grafana & Home Assistant guide here!
It contains all the information from this article and much more. Images, code and a full step by step guide on how to use Grafana and integrate it with Home Assistant – for beautiful and functional dashboards!
Displaying data
The most important job of a smart home system is to automatically control your devices, to help and support you. Maybe the second most important job is to give a good overview over the current state of your home. Home Assistant is already pretty good at this. In very short time you can create a custom dashboard that includes diagrams or current status numbers for your devices.

The above example from my guide for automated low battery warnings shows such a dashboard for the current charge states of my battery powered devices. As you may notice while it is easy to create it is not great either. Without using additional components the layout is quite strange and the diagrams while looking nice are missing a lot of important data. You also can not dynamically change the timeframe.
The built-in history tool is a little bit more powerful but also not that much better. Fortunately there is a much much better tool out there (and it is for free): Grafana. I already described how to use it with OpenHab in an earlier post. Setting this up with Home Assistant is also really easy. I did it in one evening. Lets go!
Setting up InfluxDB and Grafana
You can install Grafana on pretty much all platforms manually but I would suggest going with Docker for your smart home server to make all of this more manageable. If you want to the same simple setup I am using just head over to my GitHub repository The setup is really easy and already includes a container for Grafana and one for the database I am using here: InfluxDB.
Grafana needs a separate database in the background to load the data from. While it works with a bunch of them InfluxDB is the preferred one in most cases. If you are using my setup just start the containers via docker-compose and follow these steps to set up our new InfluxDB database. Afterwards we will connect it to Home Assistant.
// you can directly connect to the DB in the container (influxdb is the container name)
docker exec -it influxdb influx

// create a new database
create database homeassistant
// and check
show databases

// create a user
create user homeassistant with password 'supersecurepassword123'
// and check
show users

// give the users all rights to the db
grant all on homeassistant to homeassistant
That is it. You now have a new databases and a user that can read and write to it. Now lets go and connect it to Home Assistant.
Connecting Home Assistant
We can configure Home Assistant to write data for some (or all) devices to this new database. The configuration can be done via the configuration.yaml file. Before we start we need to make sure though that the database is reachable from the Home Assistant host. If you are using Docker and both containers are on the same network you can simply reach it via containername:port. In this case influxdb:8086.
If the Home Assistant container is running in host mode or on a different machine you need to forward the 8086 port from the dabase container so that it is available from the outside. You can simply add a ports section. If you want to avoid access from the outside but still need to open the database (e.g. due to host mode in Home Assistant) you can use this neat code:
ports:
  - 127.0.0.1:8086:8086
This will forward the port 8086 from the container to the host but only for the IP address 127.0.0.1 which is localhost. Access from outside will not be possible. Once the access is possible you can connect Home Assistant to the database by using a configuration like this:
# saving data to influxdb
influxdb:
  host: localhost
  port: 8086
  database: homeassistant
  username: !secret influxdb_user
  password: !secret influxdb_password
  max_retries: 3
  measurement_attr: entity_id
  include:
    domains:
      - sensor
Details can be found here but this small setup is good enough for me. Of course host and port needs to be adapted to where you can reach the InfluxDB database from your Home Assitant host. Username and password (for the homeassistant user in the database we created above) needs to be put into the secrets.yaml file in the form of influxdb_user: homeassistant.
I also used the measurement_attr setting to make sure that the (unique) entity id is used as a name for the data in InfluxDB. include or exclude blocks can be used to control what data should be saved to influxDB. In my case I decided to only send data about all of my sensors. You can also exclude certain items or domains.
After a restart Home Assistant will now start writing data to the InfluxDB database. Lets switch over to Grafana to use this data.
Building dashboards
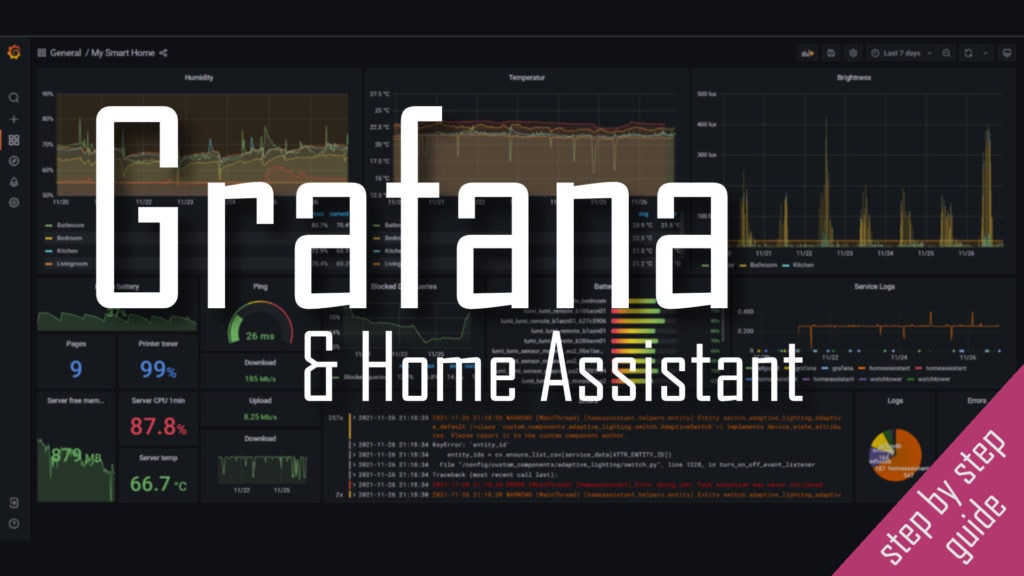
Grafana can be used to read this data and display some very pretty graphs. First you need to configuration – datasources and set up InfluxDB as a new source. In my case it looks like this.

In my setup Grafana is in the same Docker network as the InfluxDB database so you can access it directly via the Docker container name (influxdb in this case). Database and user are the ones we created above. If this is the only database I would also advise to toggle the “default” switch.
Once you are done with that you can create a new dashboard and start adding panels with data visualizations. There are a lot of possibilities here, just play around with it a bit. The toolbar to add new panels can be found at the top right corner.

Usually if you set up a new panel you just need to add queries (at the bottom menu) for each item you want to display here. In most cases you can leave the default query as is and just select the entity you are looking for in the “FROM” part. Just click on that field and you will get auto completion for all possible entities in the database.

If you are looking to change anything about the visualization you will find all those options at the right side of the screen in the “Panel” and “Field” tabs. Again just take some time and play around with those values. You will instantly see the result in the preview. If you are looking for more details you can check out my other article about Grafana and OpenHab where I go into some more detail or install new panels/datasources/… from the Grafana plugin page.
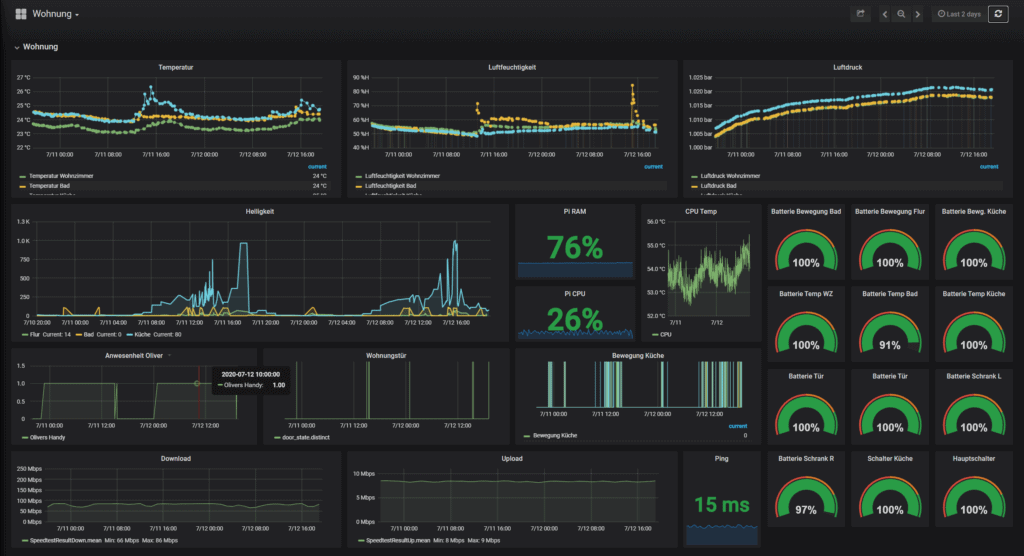
My smart home dashboard
My current Grafana dashboard is still pretty simple but it gives me a very quick overview about the state of my smart home. I can see the battery status of all devices, check my internet connection and see how temperature, brightness and humidity have changed over time. I also included my phones battery and my printer ink status for fun and added some stats for my Adguard network wide ad blocker.

Overall it looks really good (I think), definitely better than in Home Assistant and only cost me one evening of work. Now that everything is set up I can always pretty easily add more data in the future. For example I recently also added logs to the dashboard. This can be done with Loki like I described here.
If you are looking to add the full Grafana dashboards or elements of it directly to your Home Assistant dashboards follow my guide here. If you want to build dynamic panels or see my newer dashboard then checkout this post.