Beautiful smart home dashboards with Grafana
You want to see everything going on in your smart home at one glance? Then you need a smart home dashboard!
Smart home control systems like OpenHab and Home Assistant usually offer nice ways to display important data about your smart home. What they do less well is display data over time or in more complex combinations. Instead Grafana is a great tool you can use to build awesome smart home dashboards independent of the smart home controller you are using.
Update: If you are looking for a similar setup but with more focus on Home Assistant you can follow my Grafana & Home Assistant guide V2 here. Everything about Grafana is still applicable though.
Collecting data
If you run a smart home system almost by accident it will produce a lot of data. That is actually one of the reasons why you should be running as much of it as possible locally and not rely on cloud providers. Instead of giving that data to someone else you can just save it to your own database and use it to get an overview about your smart home.
Grafana is a great free tool to build dashboards that can display any data in lots of different and well looking ways. It does not collect or save the data itself though, instead it connects to a data source that you have to provide. Most smart home systems make that very easy.
I am running OpenHab on a Raspberry Pi and run an InfluxDB on the same Pi too. InfluxDB is a database designed for IoT scenarios and easily integrated into OpenHab. Simply install the plugin and configure it via the services/influxdb.cfg file. You have to create a database and a user with access to that database in InfluxDB and provide those to OpenHab in the config file. You can find more details about that with a simple Google search or for example in this post from the OpenHab forums. Then just create a new file in the persistence folder to create a strategy for when to save data to that database. Mine looks like this.
Strategies {
    everyMinute : "0 * * * * ?"
    everyHour   : "0 0 * * * ?"
    everyDay    : "0 0 0 * * ?"
}

Items {
    grHistory* : strategy = everyChange, everyHour
}
Now all you have to do is put items that you want to keep track of into the grHistory group and their status will be saved to the database whenever they change or every full hour. In my case I have separate Groups for everything I do in OpenHab. When I feel like saving the data in these groups I extend the history group like this Group grSensor (grHistory).
Of course Grafana and OpenHab also support a range of other databases but InfluxDB has been working well for me.
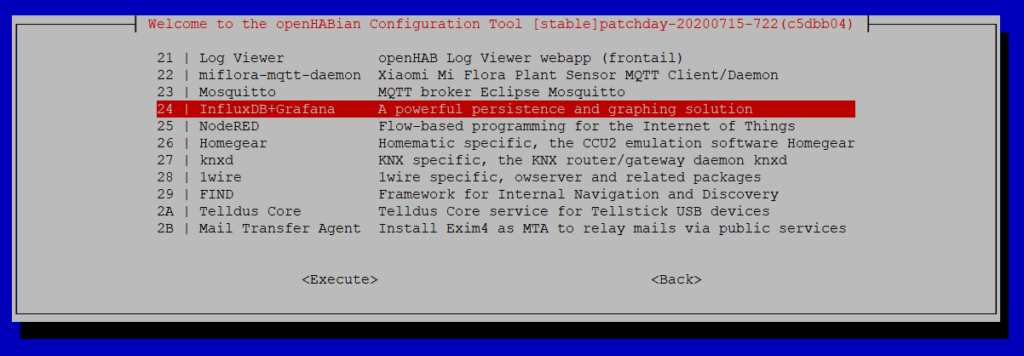
Installing Grafana & InfluxDB
Installing InfluxDB and Grafana is easy if you are using OpenHabian. Just start sudo openhabian-config and choose the “Optional Compontents”. Via this menu you can install InfluxDB+Grafana.

Both, InfluxDB as well as Grafana, are independent of OpenHab though. You can install them on pretty much any Linux system (and even on Windows) and use them with your own system. All modern open smart home systems support database export. So whether you are using OpenHab like I do, or HomeAssistant, Domoticz or something else… you should be able to build a similar setup.
Building a dashboard
Building a dashboard in Grafana is quite simple but to get an awesome one you will need to iterate and take some time. This is how you can get started though.

First we need to tell Grafana where all our data is. Open the web interface by going to port 3000 of your Raspberry Pi. Once there you should see the Grafana web interface. On first start you might get a wizard showing your around (no not Gandalf sadly). Otherwise click the small login button in the bottom left part of the dashboard first to authenticate yourself. Unless you changed it the magic combination should be admin – admin.

Now lets head over to the data source settings. Once you click the menu button you will find yourself in a new screen which allows you to add a new source. Go ahead and click the button and enter your data.
Of course these settings will depend on what users and databases you created earlier in InfluxDB but this is what worked for me. Make sure to enter a name you can recognize later and use http://localhost:8086 if you are running your InfluxDB on the same host. Under “InfluxDB Details” you need to provide your database (“table”) which you want to use. Then provide a user and his password in the auth and the DB details section. Of course this user has to have access (including write access) to the database you plan to use.

Underneath the whole settings is a test and save button which you can always use to check your configuration. If any errors occur make sure you did not misspell anything and check if the used user actually has access to that database.
Now you are ready to go! Use the big plus in the side menu to your new smart home dashboard. Each dashboard has a small menu on the top right site which can be used to manipulate the time range you want to display data in. There are also some buttons to save your changes and add new panels.
Panels are the actual parts of the dashboard that display data. They can show individual numbers (“singlestat”) or data over time (“graph”). As we collect a lot of data that is changing over time most of my dashboard is made up of graphs. To edit the content of each panel just click the small arrow on the top and chose edit.

These settings are grouped by tabs and the most important one is “Metrics” panel. Most of this will already be pre-filled but some things you need to edit. This might look daunting but it is really not that complicated. First select your database as data source. Then in the FROM row click on the second field and type in the name of the item you want to display here. In this case the CPU temperature. You will get suggestions but it is usually the name of the item in OpenHab.
The SELECT column can usually stay as it is here as well as the GROUP BY one. The fill(null) part might be important though as this will decide what happens for timeframes during which no data is available. Choosing null will make Grafana not display any data there, using 0 will default to the value 0 and previous will reuse the last value. Just play around with this if you are interested. Finally the ALIAS BY will be used to label the line in the graph.

The other tabs are mostly used to change how the data will look like. They are pretty self explanatory so I will not go into much detail here. I can recommend to change the Unit in the Axes tab though if you display data like a temperature or percentage.
My Grafana smart home dashboard
I am not using my Grafana dashboard (yes, I am only using a single one right now) to control anything in smart home or even to show everything happening right now. I use it mainly to keep an eye on critical things (like battery status, the Raspberry Pis temperature and network speeds.
It is also a great tool to see values changing over time. I am collecting temperature and humidity values for different rooms and although I currently do not use those values it is quite interesting to see them changing. I am also keeping an eye on them to avoid mould caused by high humidity.

Temperature, Humidity & Air pressure
Lets go over all the parts of my current smart home dashboard. The first row contains diagrams for temperature, humidity and air pressure in different rooms collected by my Zigbee Aqara combination sensors. While this data it is not directly needed for anything right now it is pretty interesting for me to take a look at from time to time. For example when this summer started I was able to check at which time of the last year the temperatures started to go up and compare. I am also checking humidity levels from time to time to avoid mold.
Brightness
The second row start with lux (brightness) readings that the Aqara motion sensors also produce. I have not used it yet (and honestly I could actually remove it from my dashboard) but I plan to use this to automatically dim my lights in the future.
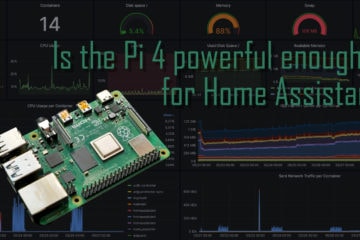
Raspberry Pi status
The next three diagrams were updated quite recently after a software bug started maxing out the CPU of my Raspberry Pi running all of this software. I was able to pretty quickly catch that due to some unusual values I saw in this dashboard. So I updated it with even more data about the Pi. Now it shows RAM and CPU usage over time, changing the color of the text if the values reach critical points. The third diagram shows the actual temperature of the Pi’s CPU. It will most likely not be destroyed by overheating but a long time of high temperatures will certainly not increase its lifespan. This will help me catch anything unusual.
Presence detection
In the third row I have three diagrams with data about presence detection. The first one shows at what time I was at home (or rather my phone was connected to my Wifi), the second shows my door opening/closing and the third one motion detected in my kitchen. This data was mostly used for debugging when I started automating my lights. It is still interesting from time to time for myself to see this data.
Internet connection
The final row shows some data about my Internet connection. After having some problems from time to time I build a system to run speedtests from time to time and collect the data. These three diagram show upload and download speeds as well as the ping. The download speed is maxed at around 80mbits due to the slow LAN connection of the Pi but nevertheless this allows me to see any incidents with my connection. I can create statistics about the uptime and send any data my provider needs to believe me if I tell him there is a problem ;).
Battery state
The set of gauges on the right side are part of my battery warning system. A good part of my sensors runs on small batteries and while the Aqara sensors should last about two years at some point they will run out of energy. To catch that and not loose automations for a longer time I build a warning system. It sends me a push message if the remaining battery percentage falls below a certain point but on the dashboard I can also see all batteries at the same time. Pretty neat.
What else can you do?
This smart home dashboard works well for me but don’t hesitate to build your own. The possibilities are pretty much endless. I have not even used all of the basic panels that are coming with Grafana but there is also an official plugin repository with even more. You are also free to change the colors or designs of the panels, which I also might do in the future.