OpenHab speedtest – keep an eye on your unstable Internet connection
Having an unreliable Internet connection is annoying. Constantly getting asked for speedtest measurements over a couple of days by your Internet provider instead of actual help is even worse. Bad enough to implement a system that regularly measures your Internet connection. This is how it can be done with OpenHab.
The speedtest
I was mainly interested in three common datapoints that describe the status of my Internet connection: upload speed, download speed and ping. Now the main question is where to get this data from. In general I see two different ways: via your router/modem/your gateway to the Internet or from the device you are running OpenHab on.
Measuring the connection on your router has several advantages: you remove other potential error sources in your network and you should always be able to measure the full speed available to you (as all traffic goes through the router). The problem is that you need to actually get this data from the router to OpenHab.
If you are using a router directly supported by OpenHab (as I do with the FritzBox!) you can use the matching binding (FritzBox binding) to retrieve the data.
As I am also running some important things on my OpenHab instance, like the water leak sensor, I wanted to also catch problems within my network. That is why I decided to run a speedtest directly from the Raspberry Pi that is running OpenHab. It has the additional benefit of being independent from the specifics of your Internet connection.
The general idea is to use a cli (command line interface) tool on the Pi to ask the speedtest.net servers for connection information. It is easy to install these tools on the linux command line like this:
#Install easy_install if not yet available
sudo apt-get install python-setuptools
# Installation of speedtest-cli
sudo easy_install speedtest-cli
# Testing
speedtest-cli
speedtest-cli --simple
Otherwise go ahead and download the script from this git repo containing the speedtest. Also go ahead and install the exec-binding in OpenHab.
Update 23.06.2020: There is now an official speedtest.net CLI that is supposed to provide even better measurements.
Measure from OpenHab
Now we need to call the speedtest tool from OpenHab. But first before we do this let’s create some items to store those values.
String      SpeedtestSummary        "Speedtest [%s]"             <"speedtest_network">
Number      SpeedtestResultPing     "Ping [%.3f ms]"             <"speedtest_next5">         (gSpeedtest)
Number      SpeedtestResultDown     "Downlink [%.2f Mbit/s]"     <"speedtest_download">      (gSpeedtest)
Number      SpeedtestResultUp       "Uplink [%.2f Mbit/s]"       <"speedtest_upload">        (gSpeedtest)
String      SpeedtestRunning        "Speedtest running ... [%s]" <"speedtest_new">
Switch      SpeedtestRerun          "Start manually"             <"speedtest_reload2">
DateTime    SpeedtestResultDate     "Last executed [%1$td.%1$tm.%1$tY, %1$tH:%1$tM Uhr]"   <"speedtest_problem4">
This mainly contains the 3 values we wanted to save (SpeedtestResultPing, SpeedtestResultDown and SpeedtestResultUp) but also some additional items we are going to use to control the process of getting the data. The icons used for these items can be found here.
For the speedtest to actually run we have to create a couple of rules. Some comments are pointing to the areas that might need changes if your setup differs. Some of the Strings used are also in German but it should be pretty obvious what they do.
val String filename = "speedtest.rules"

rule "Speedtest init"
when
    System started
then
    createTimer(now.plusSeconds(195)) [|
        if (SpeedtestRerun.state == NULL) SpeedtestRerun.postUpdate(OFF)
        if (SpeedtestRunning.state == NULL) SpeedtestRunning.postUpdate("-")
        if (SpeedtestSummary.state == NULL || SpeedtestSummary.state == "")
            SpeedtestSummary.postUpdate("⁉ (unbekannt)")
    ]
end

rule "Speedtest"
when
    //Time cron "0 0 5,13 * * ?" or
    Time cron "0 0 * * * ?" or
    Item SpeedtestRerun received command ON
then
    logInfo(filename, "--> speedtest executed...")
    SpeedtestRunning.postUpdate("Messung läuft...")

    // update timestamp for last execution
    SpeedtestResultDate.postUpdate(new DateTimeType())

    // execute the script, you may have to change the path depending on your system
    var String speedtestCliOutput = executeCommandLine("/home/openhabian/speedtest-cli@@--simple", 120*1000)

    // for debugging:
    //var String speedtestCliOutput = "Ping: 43.32 ms\nDownload: 21.64 Mbit/s\nUpload: 4.27 Mbit/s"
    logInfo(filename, "--> speedtest output:\n" + speedtestCliOutput + "\n\n")

    SpeedtestRunning.postUpdate("Datenauswertung...")

    // starts off with a fairly simple error check, should be enough to catch all problems I can think of
    if (speedtestCliOutput.startsWith("Ping") && speedtestCliOutput.endsWith("Mbit/s")) {
        var String[] results = speedtestCliOutput.split("\\r?\\n")
        var float ping = new java.lang.Float(results.get(0).split(" ").get(1))
        var float down = new java.lang.Float(results.get(1).split(" ").get(1))
        var float up   = new java.lang.Float(results.get(2).split(" ").get(1))
        SpeedtestResultPing.postUpdate(ping)
        SpeedtestResultDown.postUpdate(down)
        SpeedtestResultUp.postUpdate(up)
        SpeedtestSummary.postUpdate(String::format("ᐁ  %.1f Mbit/s  ᐃ %.1f Mbit/s (%.0f ms)", down, up, ping))
        SpeedtestRunning.postUpdate("-")
        logInfo(filename, "--> speedtest finished.")
    } else {
        SpeedtestResultPing.postUpdate(0)
        SpeedtestResultDown.postUpdate(0)
        SpeedtestResultUp.postUpdate(0)
        SpeedtestSummary.postUpdate("(unbekannt)")
        SpeedtestRunning.postUpdate("Fehler bei der Ausführung")
        logError(filename, "--> speedtest failed. Output:\n" + speedtestCliOutput + "\n\n")
    }
    SpeedtestRerun.postUpdate(OFF)
end
The rules will update the status after startup of the system to “unknown” and otherwise run a new speedtest every full hour or whenever the “SpeedtestRerun” item is activated.
Now that this is set up we can also build a new section on the basicUI to display this data.
Frame label="Connections" {
        Text item=SpeedtestSummary {
            Frame label="Results" {
                Text item=SpeedtestResultDown
                Text item=SpeedtestResultUp
                Text item=SpeedtestResultPing
            }
            Frame label="Control" {
                Text item=SpeedtestResultDate
                Text item=SpeedtestRunning label="Speedtest [%s]" visibility=[SpeedtestRunning != "-"]
                Switch item=SpeedtestRerun mappings=[ON="Start"]
            }
            Frame label="Statistic" {
                Text label="..." icon="speedtest_analytics8"
            }
        }
    }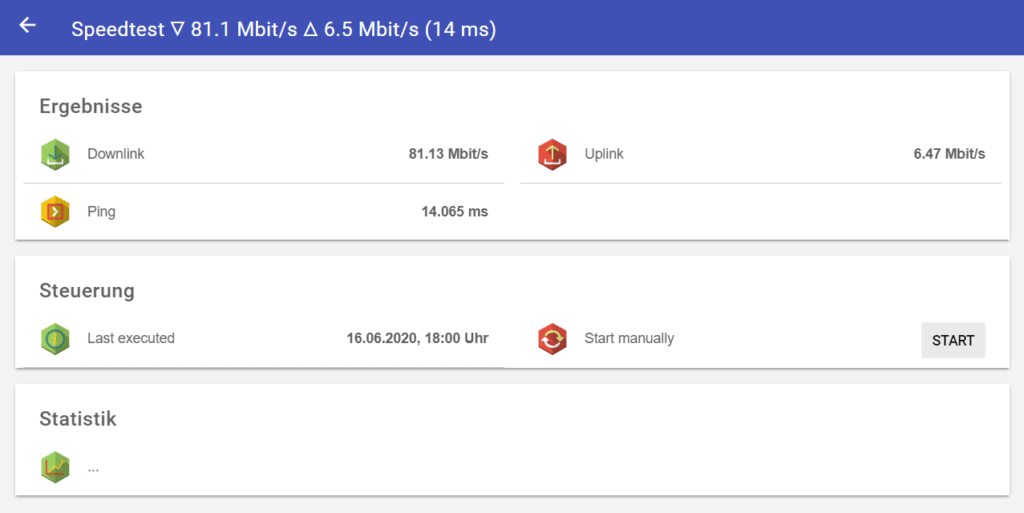
The statistics part could be used to display a graph but I solved this somewhere else.
Display in Grafana
Remember the “(gSpeedtest)” part of my items file? This means all those relevant items are part of the gSpeedtest group. That group itself is part of the grHistory group which gets saved to my influxDB. I have described this in a little bit more depth in my post about my battery level warning system.
With this data saved over time into the database we can use it to draw some pretty graphs so changes in the connection quality can be seen on first glance. If you need more details here is a full guide on how to create a Grafana dashboard.
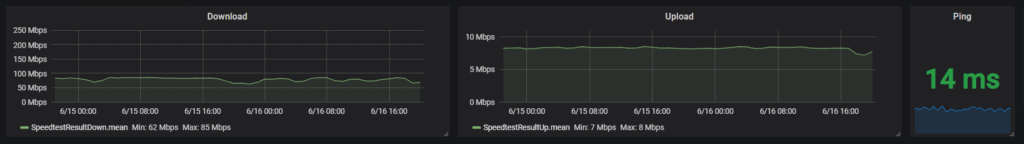
I decided to display downlink and uplink speeds over time as well as the maximum ping during this timeframe. This allows me to see any problems right away. In the screenshot above everything looks fine. Here as an example of the data during some outages though:
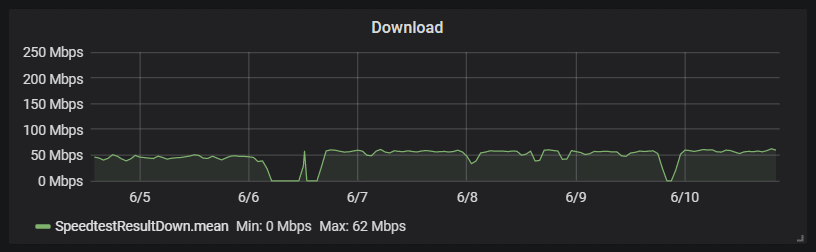
As you can see the download speed was 0 for about one day and then again later for a couple hours. It is also pretty easy to export this data and send it to the provider in case they are not believing you.
There is one important fact about Rasperry Pi networking though that comes into play here: the older Pi models do not support Gigabit LAN. That is why my 200 Mbps Internet connection is only showing values of around 50Mbps here. As I am mostly interested in the overall quality and uptime of the connection this is totally fine though. If you are looking for a faster LAN connection to measure the full speed consider switching to a Raspberry Pi 4.
If you are interested in buying the Pi 4 consider doing it via my affiliate link here. It does not cost you any more money and allows me to pay the servers 😉
This setup is quite easy and once done you don’t really need to touch it anymore. It is just always there if you need it.