Taming Loki’s hunger – reclaiming disk space used by limiting the Loki log size (for the docker plugin)
The Grafana Loki logging aggregator is a great tool to collect logs from lots of places (Docker containers) in one place. Loki log size can unfortunately grow quite big though with the default settings. When my Raspberry Pis SD card was nearly full I looked for some ways to combat this behavior.
The Loki log aggregation software
I run a lot of Docker containers on my smart home server. Each of them might produce important logs and having to read through them one by one on the command line to find possible errors can be quite time consuming. Instead there is a better solution: a log aggregation system that collects all logs in one place.
The best known one is the ELK stack around Kibana but that needs a lot of resources and is difficult to set up. Instead I chose the Loki software from the makers of Grafana. Setup was quite easy and it has been working well so far for my needs. The integration with the awesome Grafana dashboard tool is also super simple.
I had it set up with a plugin for Docker and a couple of lines of config in the docker compose files.
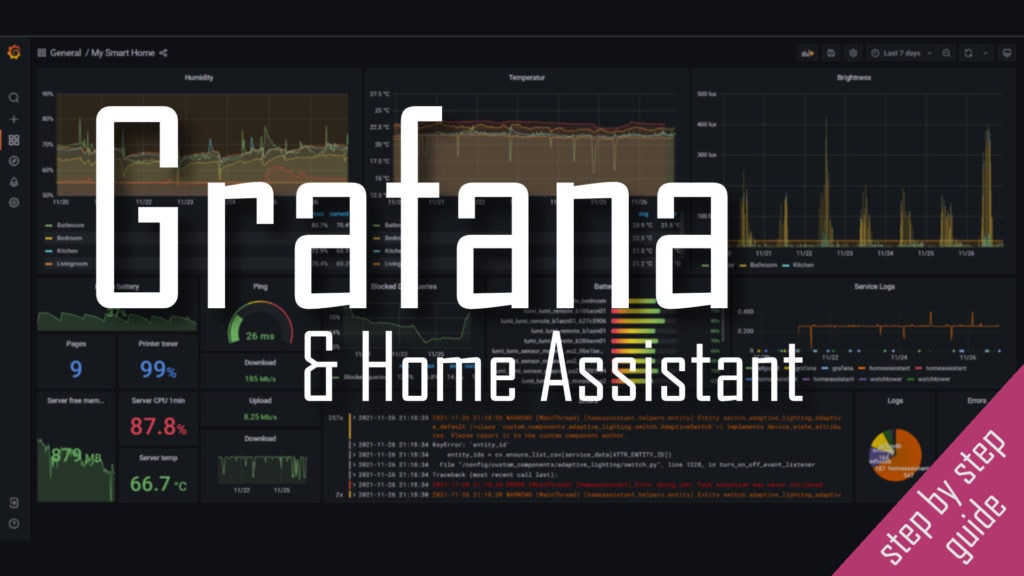
If you are looking for an even better shortcut in your smart home journey check out my new Grafana & Home Assistant guide here!
It contains all the information from this article and much more. Images, code and a full step by step guide on how to use Grafana and integrate it with Home Assistant – for beautiful and functional dashboards!
What ate my hard disk?
Recently I was looking to update my Home Assistant installation to a newer version and the new image needs >1GB of disk space. Checking the available space beforehand I noticed that my 30GB SD card was 97% percent full! Very weird as my actual data is on an external SSD.
Some quick search found the culprit: the Loki docker plugin was using around 19GB somehow!
df -h
-------
Filesystem      Size  Used Avail Use% Mounted on
/dev/root        29G   27G  1.1G  97% /
devtmpfs        776M     0  776M   0% /dev
tmpfs           937M     0  937M   0% /dev/shm
tmpfs           937M   67M  870M   8% /run
tmpfs           5.0M  4.0K  5.0M   1% /run/lock
tmpfs           937M     0  937M   0% /sys/fs/cgroup
/dev/mmcblk0p1  253M   49M  204M  20% /boot
/dev/sda1       117G  5.0G  106G   5% /mnt/extssd
tmpfs           188M     0  188M   0% /run/user/1000

sudo du -ahx / | sort -rh | head -5
-------
24G     /var/lib/docker
19G     /var/lib/docker/plugins/626228deed68f00b210a82b98bb11c9f7971a3306897b8b501f649f069776766/rootfs
19G     /var/lib/docker/plugins/626228deed68f00b210a82b98bb11c9f7971a3306897b8b501f649f069776766
19G     /var/lib/docker/plugins
18G     /var/lib/docker/plugins/626228deed68f00b210a82b98bb11c9f7971a3306897b8b501f649f069776766/rootfs/var/log/docker/3611be7edfbac97f55df22d11f8bf67f74bccb23b639e967b0a707499c85d365/json.log
After double checking the 3611be7ed... id in the folder name I noticed that this is the Loki server container itself. Apparently the Docker plugin writes all its data also to a json file to be compatible with normal Docker logging. Looks like the Loki container was logging a lot and not much important stuff.
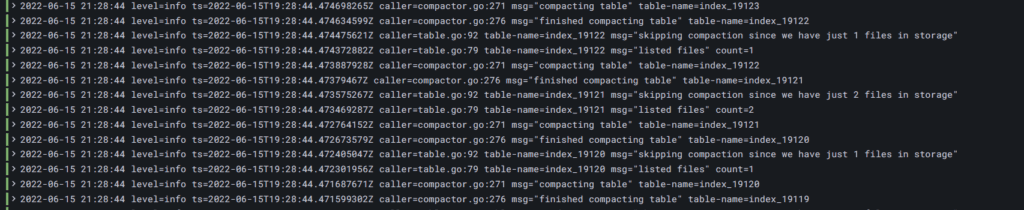
In the default configuration the plugin has no size limit for these log files but will forget everything on restart/recreating the container. A quick fix was just a restart of this container (as I don’t need its logs) which instantly freed up gigabytes of disk space.
docker-compose -f hosting.yml stop loki
docker-compose -f hosting.yml up -d loki

df -h
Filesystem      Size  Used Avail Use% Mounted on
/dev/root        29G  7.1G   21G  26% /
Setting boundaries – configuring a maximum Loki log size
Manual cleanup works but should not be something I have to do regularly – after all this blog is about home automation ;-). It turns out there are a couple of interesting arguments you can provide to Loki to fix this problem.
max-size will set a maximum size of the log file before switching to a new one. max-file will control the number of files that Loki keeps and keep-file will tell it to keep these files alive after a container restart. A full configuration using these values can look like this:
loki:
    container_name: loki
    image: grafana/loki:2.3.0
    restart: unless-stopped
    ports:
      - "127.0.0.1:3100:3100"
    volumes:
      - ${DATADIR}/loki/config/loki-config.yaml:/etc/loki/loki-config.yaml
      - ${DATADIR}/loki/data:/data/loki
    command: -config.file=/etc/loki/loki-config.yaml
    logging:
      driver: loki
      options:
        loki-url: "http://localhost:3100/loki/api/v1/push"
        max-size: "200m"
        max-file: 2 # I am not using this
        keep-file: true # I am not using this
The size value consists of a number and a unit (k for kilobyte, m for megabyte or g for gigabyte). I do not need to keep the log files after a restart or have more than one file so I am simply using the max-size argument with different sizes (less for unimportant services, more for things like Home Assistant) to prevent these big files in the future.
Once you have added these configurations you need to simply recreate all your containers via docker-compose to apply them. That is it: now Loki should behave!
I also updated my smarthome server Github repository to include these limits.