Monitoring your smart home server with prometheus on a Raspberry Pi – use the power of professional tools
To analyze errors or just to watch what is happening: your smart home gets so much better with some proper monitoring. Prometheus + Grafana is one of THE solutions for monitoring pretty much anything. Getting it to run on a Raspberry Pi does not need much time but still can be a bit tricky. Here is how to do it.
What is prometheus?
Prometheus is an open source monitoring system originally build by SoundCloud back in 2012. It is used in many professional setups and works very well with Grafana as a frontend – that is why I thought it a great fit for my smart home that is already displaying smart home sensor data via InfluxDB and logs via Loki in Grafana. I even already added some hardware monitoring data via simple monitoring script and MQTT.
Prometheus is a way more powerful and extensible solution though. The software itself is just the server. It stores data and can be queried by tools like Grafana, or for simple uses cases also its web UI, to display said data. To actually get the data you have to run so called exporters on the client(s) itself. Prometheus will then go and ask them for data (“scraping”) regularly.
Due to the open-source nature and the high number of users there are exports for pretty much everything: Linux hosts, Windows hosts, Docker, databases, some hardware equipment, AWS and much more. For this guide we will concentrate on the node exporter for data about the Raspberry Pi host and cadvisor for data about the Docker containers.
Setting up prometheus & exporters
While you can directly install prometheus and the exporters I will use the same docker-compose setup here as in the rest of my smart home setup. Using Docker this setup can be done in 5 minutes. The only challenges are to mount the right directories and to find images working on the ARM architecture of the Raspberry Pi.
Installing node exporter
Lets start with the node exporter used to export data about the Raspberry Pi itself. I put all the code in a new monitoring.yml file which you can of course as always find in my Github repository. Here we are basically just starting a new container with the usual image, name and my Loki logging setup. Although I don’t like from a security standpoint we also need to map the root directory (as read only to at least have some separation there) and set the PID space to host to be able to access everything needed for data collection.
node_exporter:
    image: prom/node-exporter
    container_name: node_exporter
    command:
      - '--path.rootfs=/host'
    pid: host
    restart: unless-stopped
    volumes:
      - '/:/host:ro,rslave'
    logging:
      driver: loki
      options:
        loki-url: "http://localhost:3100/loki/api/v1/push"
        max-size: "10m"
Installing cadvisor
The node exporter will give us information and metrics about the OS itself. As I am running everything essential in Docker containers I was looking for a solution to also collect more information about that. I found cadvisor – short for container advisor – an exporter build by Google to collect such metrics.
The installation is similar to node exporter. Add the new service with the usual settings and with mounts for a couple of volumes and devices needed to collect the data. Again we are using read only mode wherever possible.
Update: I switched to another image here and added a couple of commands that drastically decrease CPU usage of the container. You can read more about this here.
If you want to collect container memory metrics on the Raspberry Pi you will also most likely need to add these lines to your cmdline file. I also explained that in the new post linked above.
sudo nano /boot/cmdline.txt
// add at the end of the line:
cgroup_enable=cpuset cgroup_enable=memory cgroup_memory=1
// save & reboot
Afterwards just restart the Pi. Here is the current container definition:
cadvisor:
    #image: gcr.io/cadvisor/cadvisor
    image: zcube/cadvisor:latest
    container_name: cadvisor
    command:
      - "--docker_only=true"
      - "--housekeeping_interval=30s"
      - "--disable_metrics=accelerator,cpu_topology,disk,memory_numa,tcp,udp,percpu,sched,process,hugetlb,referenced_memory,resctrl,cpuset,advtcp,memory_numa"
    volumes:
      - /:/rootfs:ro
      - /var/run:/var/run:ro
      - /sys:/sys:ro
      - /var/lib/docker/:/var/lib/docker:ro
      - /dev/disk/:/dev/disk:ro
      - /etc/machine-id:/etc/machine-id:ro
    devices:
      - /dev/kmsg
    restart: unless-stopped
    logging:
      driver: loki
      options:
        loki-url: "http://localhost:3100/loki/api/v1/push"
        max-size: "10m"
One important note here though: unfortunately no official arm based container images are published so if you use the default gcr.io/cadvisor/cadvisor the exporter will not properly start on your Raspberry Pi system (all non arm systems should be fine though). Instead you need to chose another image. Unfortunately there seems to be no de facto standard for that but I have been running edsonmoreirajr/cadvisor-armzcube/cadvisor without problems so far.
Installing and configuring prometheus
Now that all the exporters are ready we can finally add prometheus and configure it to scrape the data. The software itself will again be run in a Docker container by adding this to the compose file:
prometheus:
    image: prom/prometheus:v2.37.0
    container_name: prometheus
    restart: unless-stopped
    user: ${PUID}:${PGID}
    ports:
      - "9090:9090"
    volumes:
      - ${DATADIR}/prometheus/etc:/etc/prometheus
      - ${DATADIR}/prometheus/data:/prometheus
    command:
      - "--config.file=/etc/prometheus/prometheus.yml"
    logging:
      driver: loki
      options:
        loki-url: "http://localhost:3100/loki/api/v1/push"
        max-size: "10m"
Again I added the standard lines for each container, the logging setup is optional as well as pinning the image to a certain version. If you are looking for automatic updates have a look at my watchtower setup or if you just want update notifications check out Diun. I opened port 9090 here to have access the web UI and allow Grafana (running in another docker network) access.
It is also important to either use Docker volumes or define the user and set it to the same one that controls the ${DATADIR}/prometheus/... folders so that prometheus can access its own configuration file properly. If you need to change that you can use the (sudo) chown user:group path/to/file command. Be careful with using the root user though as that can be a security concern.
Finally before you start anything you have to (change if needed and) copy the configuration file into place. A quick mkdir /some/data/dir/prometheus/etc and cp prometheus_config.yaml /some/data/dir/prometheus/etc/prometheus.yml should do the trick (replacing the data directory with the one you have configured in your env file of course). The configuration file itself is simple. It just contains the interval in which the server should ask the exporters for new data and defines where to find those.
global:
  scrape_interval:     15s # By default, scrape targets every 15 seconds.

  # Attach these labels to any time series or alerts when communicating with
  # external systems (federation, remote storage, Alertmanager).
  # external_labels:
  #  monitor: 'codelab-monitor'

# A scrape configuration containing exactly one endpoint to scrape:
# Here it's Prometheus itself.
scrape_configs:
  # The job name is added as a label `job=<job_name>` to any timeseries scraped from this config.
  - job_name: 'prometheus'
    # Override the global default and scrape targets from this job every 5 seconds.
    scrape_interval: 5s
    static_configs:
      - targets: ['localhost:9090']

  # Example job for node_exporter
  - job_name: 'node_exporter'
    static_configs:
      - targets: ['node_exporter:9100']

  # Example job for cadvisor
  - job_name: 'cadvisor'
    static_configs:
      - targets: ['cadvisor:8080']
Careful, this only works if your exporters are in the same Docker network as your prometheus server (and can therefore be reached via DNS under their container names), otherwise you might have to specify IP addresses or other working DNS names.
Now a final docker-compose -f monitoring.yaml up -d (or using docker compose … on newer systems) should start all the new containers. Check the logs if they are all starting properly or visit server:9090 to check the prometheus frontend. Under status – targets you should see all the targets you defined as green: the two exporters and some data about the prometheus server itself.
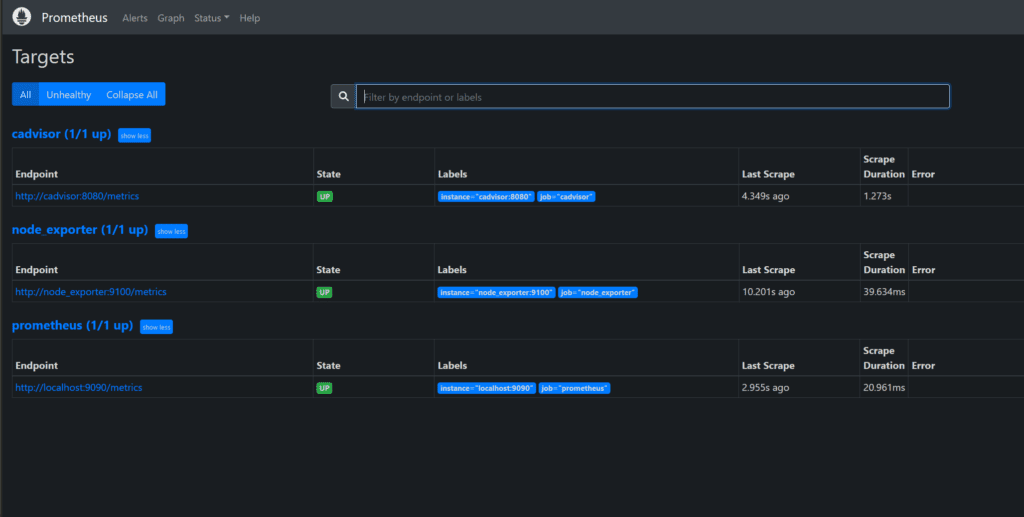
If anything is not green here check the logs and the configuration to fix it. Now prometheus will start collecting metrics and we can start showing them in Grafana.
Showing prometheus data in Grafana
The first step of adding this data to Grafana is adding a new datasource. Click configuration – data sources – add data source and select prometheus. If everything is running in the same network the URL http://prometheus:9090 should work. Click Save & test and the data should be available now.
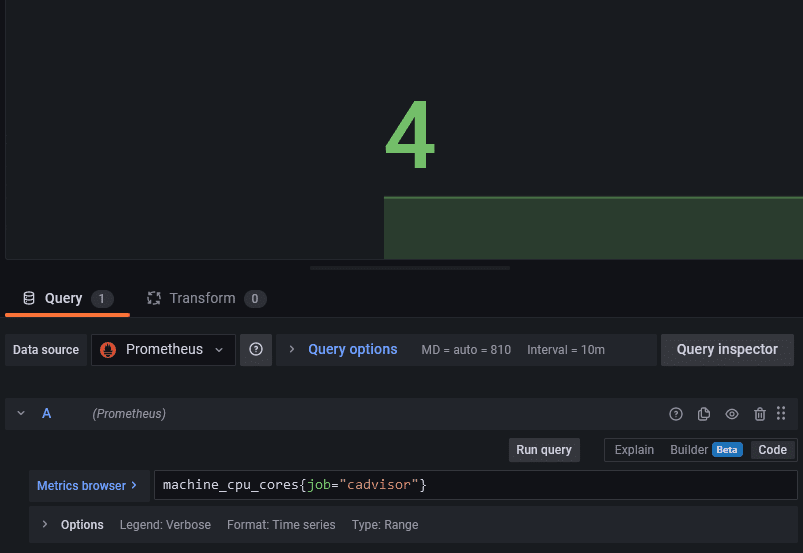
Prometheus uses its own PromQL language to request data. You can use that in any dashboard you have to display data but I think it is not super intuitive to use and a bit different from say InfluxDB queries.
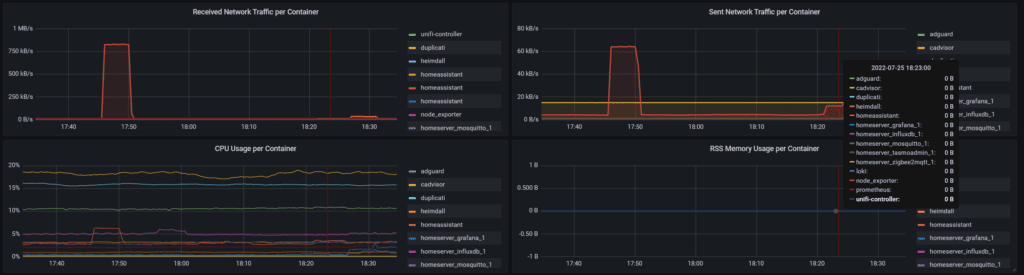
Fortunately as this is a setup used by many people out there this problem is already solved. On the Grafana homepage you can find many premade dashboards. I downloaded node exporter full dashboard to display all kinds of information about my server and the docker + system dashboard for more information about the single containers.
Especially the second dashboard is the one I am still using after quite some time. Seeing memory & CPU consumption, network traffic and more can be really helpful when trying to find and fix issues with your setup.
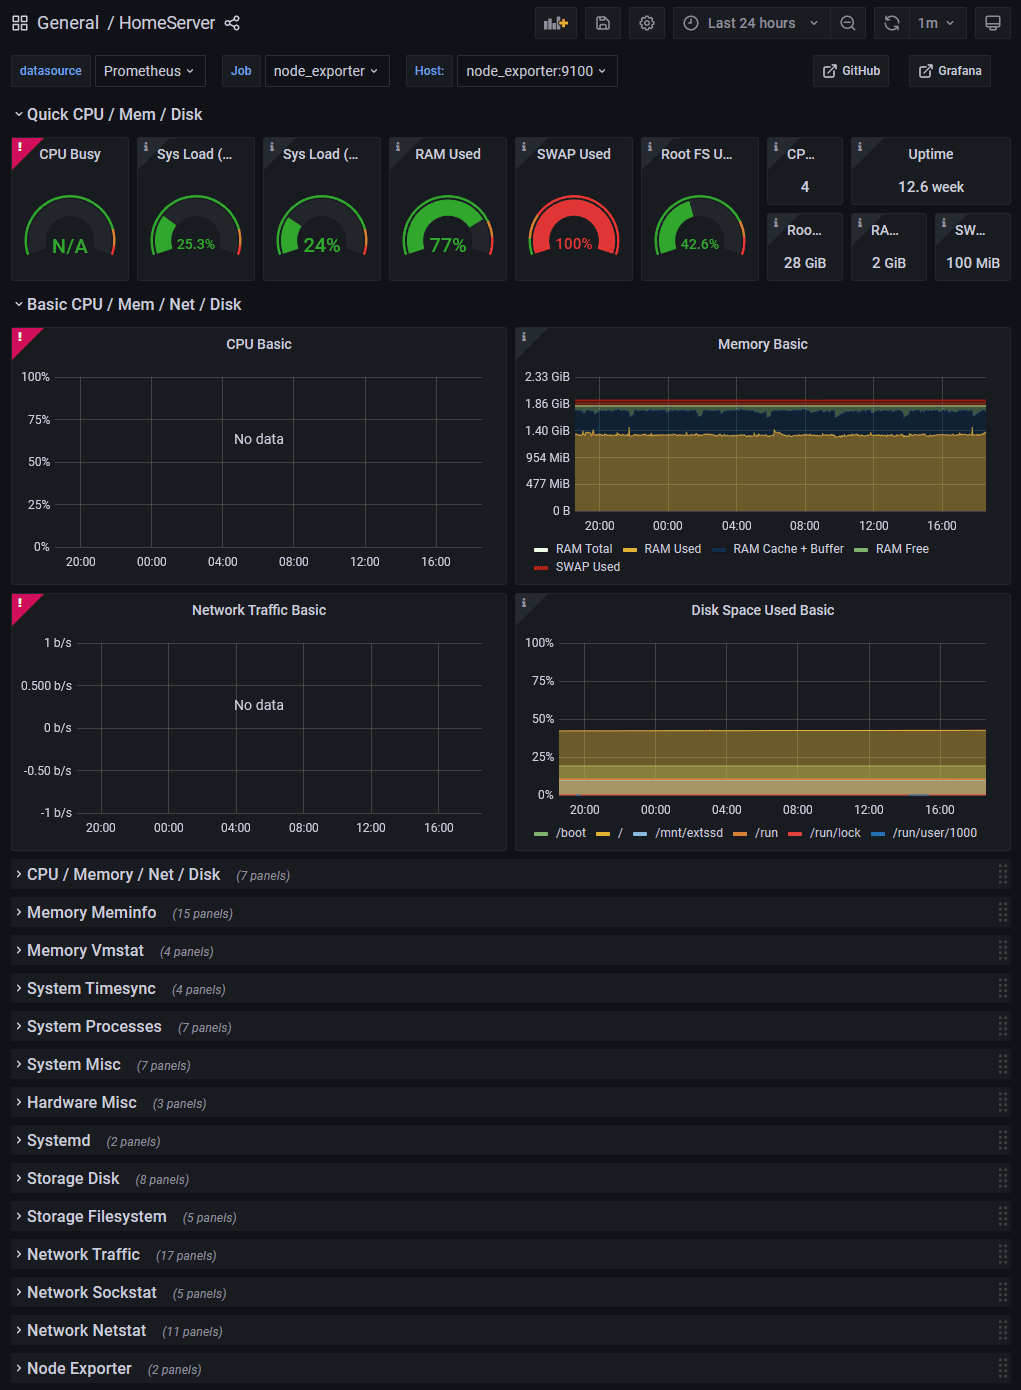
It seems like some information, especially about CPU usage, is missing or not working properly with the Raspberry Pi but the rest is right there. Over time I will update this data and add the most important parts to my own dashboard. Of course I will also update this post once that is done.
Check out my follow-up post to see how I fixed missing RAM metrics and the high CPU usage of cadvisor. I have also already updated this post here with the essentials.