Monitoring Raspberry Pis with Home Assistant – get ahead of any failure with this simple setup
A smart home server is the heart of your setup. It needs to be running well to power everything else. Monitoring Raspberry Pis, my favorite low power server, is easy to set up and helps you to detect errors early on. This is how you can easily set up monitoring for any Raspberry Pi in your network with Home Assistant and Grafana support.
Keeping an overview – monitoring Raspberry Pis
If your core smart home server goes down most of your smart home will stop working. Most of the time the issue that crashes your server in one way or another will not just suddenly happen. Instead it is usually a gradual buildup of for example a faulty process that uses more and more resources over time until it crashes the full system.
Raspberry Pis are awesome as a low power server, and I am using one myself for my smart home setup. As they usually run in headless mode without any display and are hidden somewhere it might take you too much time to notice when they run into any problem.
- A Raspberry Pi, preferably the Pi 4 with 2 or 4 GB of RAM
- A USB (C for the Pi 4, Micro USB for the older ones) power supply with around 3.0A
- A microSD card, 16+GB from a reliable manufacturer, should be fast: class 10/UHS-1
- Optional: a case (with cooling) for the Pi or at least heatsinks
- Optional: if you don’t have one yet buy a SD card reader/writer
- Optional: Network access. Either a LAN cable or if you are not using a newer Pi a seperate Wifi USB dongle.
- Alternatively you can get a kit including everything you need
If you are interested in buying a Raspberry Pi for your smart home consider doing it via my affiliate links above. It does not change prices for you and allows me to pay for the servers 😉
I have run into such a problem back when I was still using OpenHab and have set up a monitoring system back then. Now I am looking to set up a similar system with Home Assistant and make it even better by being able to not just monitor the server itself but also all other Pis I have running.
The system will be built from different components: a daemon (long living process) that runs on each Pi to collect the data, my MQTT server that this data is send to, Home Assistant to save the data and send alarms and Grafana to show some nice stats.
Collecting the data
The first step to working with data about the Pis is to actually collect it. To do that in a simple and convenient way I am using the awesome work of ironsheep over on GitHub. His daemon called RPi Reporter MQTT2HA Daemon runs on the Pi and regularly collects data that is then send to a MQTT message.
The installation is quite easy if you follow the official instructions. You basically clone the repo and copy some files. The configuration of course depends on your needs but I only changed a couple of things.
hostname = localhost
port = 1883
base_topic = home/nodes
The Pi I am checking for is the smart home server itself, so the hostname for the MQTT server is set to localhost. If you are running this on another one you need to provide the IP address/hostname of the smart home server with the MQTT server here. The port is also the default.
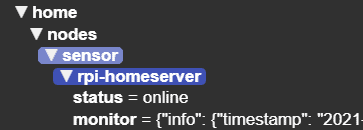
I also defined the base topic that the daemon is going to use for the updates. Under that it will place a sensor/yourPiName topic with the status and more info about your monitor.
Make sure to follow the instructions and set up the daemon as a constantly running service.
Reading the data with Home Assistant
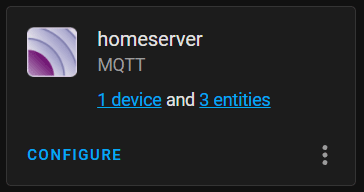
Now that the data is sent to MQTT Home Assistant should automatically detect it if you have already installed the MQTT integration. In my case it looks like this:
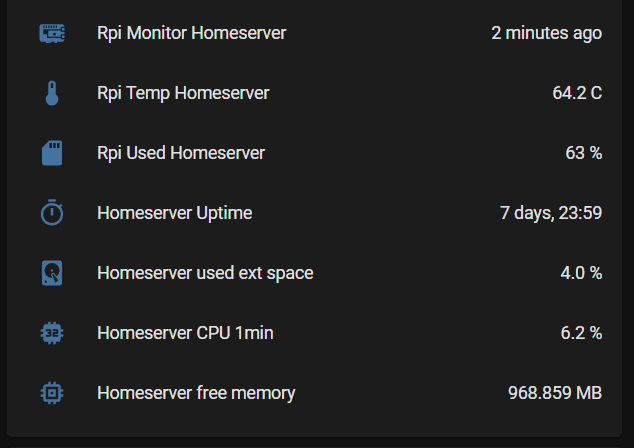
It is now pretty easy to show this data in a nice custom card done by the same author. You can install it via HACS, by installing the lovelace-rpi-monitor-card repo. After installation it is simple to add to your dashboard. Just point it to your MQTT entity like this
type: custom:rpi-monitor-card
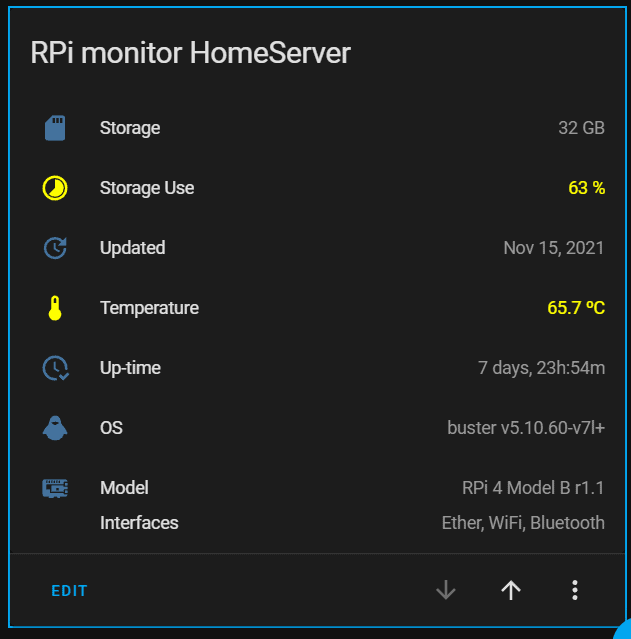
entity: sensor.rpi_monitor_homeserverThis will result in a nice looking card like this, that even includes color coded (mine is running a bit too hot) data about your Pi.
You could stop at this point if you are just looking for a way to check on your Pi from time to time. I was also looking for some alerts and graphs in Grafana so I kept going. Most of the data is “hidden” in the attributes of the main sensor as it is all send in one MQTT topic. Fortunately it is easy to extract this to new entities by using a template. This template can just be added as text to your main configuration.yaml file.
# data about homeserver state extracted
template:
  - sensor:
      - name: "Homeserver Uptime"
        unique_id: "sensor.rpi_monitor_homeserver.uptime"
        icon: mdi:timer-outline
        state: >
          {{ state_attr('sensor.rpi_monitor_homeserver', 'up_time') }}
      - name: "Homeserver used ext space"
        unique_id: "sensor.rpi_monitor_homeserver.mnt-extssd_space_prcnt"
        icon: mdi:harddisk
        unit_of_measurement: "%"
        state: >
          {{ state_attr('sensor.rpi_monitor_homeserver', 'drives')["mnt-extssd"].used_prcnt | float }}
      - name: "Homeserver CPU 1min"
        unique_id: "sensor.rpi_monitor_homeserver.cpu_1min"
        icon: mdi:cpu-32-bit
        unit_of_measurement: "%"
        state: >
          {{ state_attr('sensor.rpi_monitor_homeserver', 'cpu').load_1min_prcnt | float }}
      - name: "Homeserver free memory"
        unique_id: "sensor.rpi_monitor_homeserver.free_memory"
        icon: mdi:memory
        unit_of_measurement: "MB"
        state: >
          {{ state_attr('sensor.rpi_monitor_homeserver', 'memory').free_mb | float }}
Adding this (of course with the correct sensor name) will result in four more entities on your dashboard which extract uptime, space for my external SSD, CPU and RAM usage. You can add any other data in a similar way.
Now, this is easier to view and also will result in Home Assistant automatically pushing this sensor data to InfluxDB which makes it available to Grafana. That is if you have set up Grafana like I described in my in-depth guide here.
Showing the data in Grafana
Once the data in InfluxDB it is simple to add it to a dashboard. I am still experimenting with this but for now I have added it to a corner of my dashboard that is displaying info about my home network and some devices.
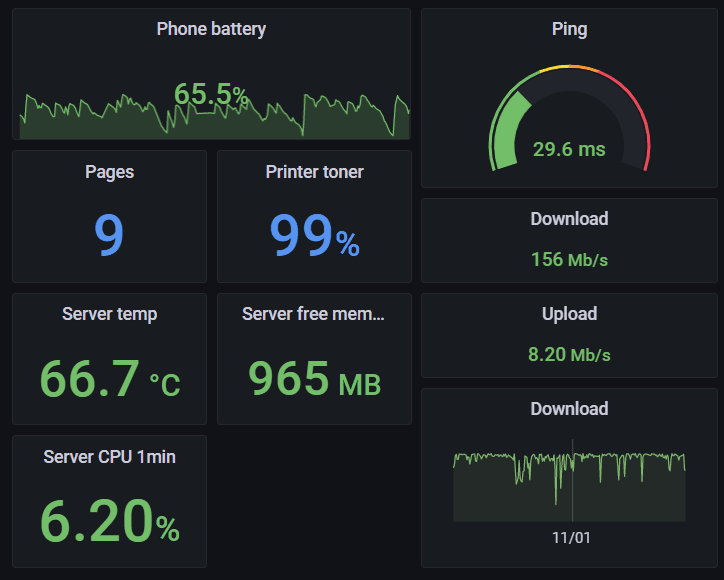
These 3 blocks in the left bottom corner are simple “stat” panels in Grafana that use the new data from Home Assistant. I only provided a title and a unit (MB/°C/%). Here is one example:
{
  "id": 39,
  "gridPos": {
    "h": 3,
    "w": 2,
    "x": 2,
    "y": 20
  },
  "type": "stat",
  "title": "Server free memory",
  "pluginVersion": "8.2.4",
  "fieldConfig": {
    "defaults": {
      "thresholds": {
        "mode": "absolute",
        "steps": [
          {
            "color": "red",
            "value": null
          },
          {
            "color": "orange",
            "value": 200
          },
          {
            "color": "green",
            "value": 500
          }
        ]
      },
      "mappings": [],
      "color": {
        "mode": "thresholds"
      },
      "unit": "decmbytes"
    },
    "overrides": []
  },
  "options": {
    "reduceOptions": {
      "values": false,
      "calcs": [
        "lastNotNull"
      ],
      "fields": ""
    },
    "orientation": "auto",
    "text": {},
    "textMode": "auto",
    "colorMode": "value",
    "graphMode": "area",
    "justifyMode": "auto"
  },
  "targets": [
    {
      "groupBy": [
        {
          "params": [
            "$__interval"
          ],
          "type": "time"
        },
        {
          "params": [
            "null"
          ],
          "type": "fill"
        }
      ],
      "hide": false,
      "measurement": "sensor.free_memory",
      "orderByTime": "ASC",
      "policy": "default",
      "refId": "A",
      "resultFormat": "time_series",
      "select": [
        [
          {
            "params": [
              "value"
            ],
            "type": "field"
          },
          {
            "params": [],
            "type": "mean"
          }
        ]
      ],
      "tags": []
    }
  ],
  "datasource": null
}
Building an alert
The final step are automated alerts when your server is near critical values. In my case I decided for >90% CPU usage or <200MB RAM left for more than 5 minutes (to avoid alarms in case of small spikes). This will give me some peace of mind and is easy to set up in Home Assistant.
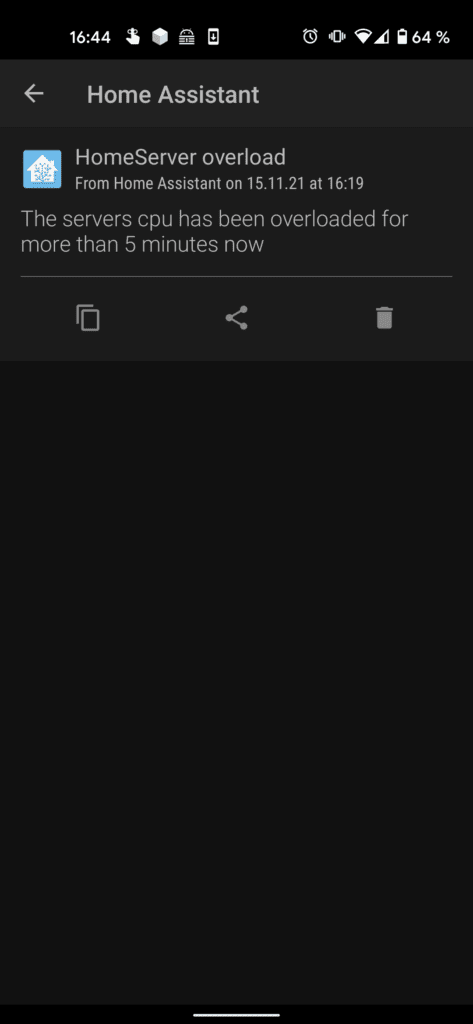
For this automation I am using the build in notifications of Home Assistant but also my Pushover setup so that I get push notifications to my phone. The alarm includes two triggers, one for CPU and one for RAM, and sends the same message but including a different word per trigger. It looks like this:
alias: HomeServer Pi Alarm
description: 'Sends an alarm if a Raspberry Pis CPU or RAM values reach a critical level'
trigger:
  - platform: numeric_state
    entity_id: sensor.cpu_1min
    id: CPU
    above: '90'
    for: '00:05:00'
  - platform: numeric_state
    entity_id: sensor.free_memory
    id: RAM
    below: '200'
    for: '00:05:00'
condition: []
action:
  - service: notify.persistent_notification
    data:
      message: >-
        The servers {{trigger.id}} has been overloaded for more than 5 minutes
        now
      title: HomeServer overload!
  - service: notify.pushover
    data:
      message: >-
        The servers {{trigger.id}} has been overloaded for more than 5 minutes
        now
      title: HomeServer overload
mode: single
This results in a quick push message like this on my phone, and will hopefully give me enough time to fix the issue. Or at least restart the Pi and figure out what happened using the historic data in Grafana. Pretty neat!