Fixing Docker stats and Cadvisor CPU usage (on a Raspberry Pi)
Prometheus works great for collecting server stats on a Raspberry Pi but was missing some information on a Raspberry Pi in docker stats and the cadvisor used more CPU than the containers it was monitoring. Here is how fixed those issues.
Cleaning up & fixing the downloaded dashboards
When I set up my monitoring via Prometheus in my last post it was working mostly well but still had some issues. The first one was that a bunch of metrics were missing in dashboards I downloaded, like CPU and network info in the image below.

For the most part this was not caused by actual missing data but instead by the “PromQL” (Prometheus querying language) statement used to get the data. I do not know if these dashboards were build for Kubernetes or some similar tool instead of pure Docker(-compose) but they mostly contained a filter for instance="$node" which seems not to be set by default.
Simply removing that node related code from the query fixed those graphs for me. For example some_metric_collected{instance="$node",job="$job"} becomes some_metric_collected{job="$job"}. This can be done by clicking the header of each diagram and selecting the edit option.

Finally I also removed some panels I am not really using and upgraded the remaining ones. Most were still using the old time series and can be upgraded with one click in the edit mode to the new time series. No major changes but it just looks a bit nicer.

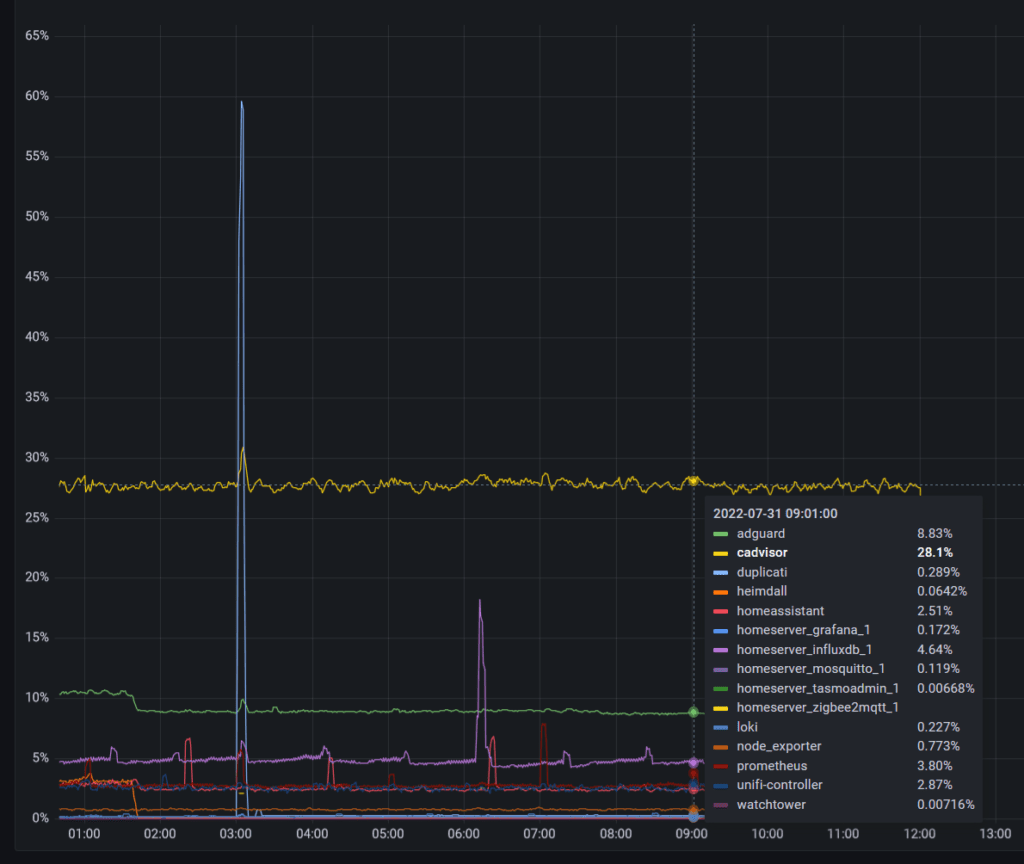
I also added some values (mean for CPU usage for example and last non-null value for RAM usage) to the legend. This allows you to easily sort all containers by their memory or CPU usage.
Fixing memory monitoring on a Raspberry Pi
Even after these updates my dashboard was somehow still missing data about the memory usage on my Raspberry Pi, at least for the Docker containers. It seemed like Prometheus had crashed a couple of times due to out of memory issues so I really wanted to have those numbers. A quick check using docker stats showed … nothing really.
The stats command shows CPU and RAM usage of your containers but in my case it was only showing 0 for everything memory related. After some quick googling I checked docker info and that was printing a couple of warning at the end including these about memory:
$ docker info
...
WARNING: No swap limit support
WARNING: No memory limit support
It seems like by default some Control Groups related settings are not enabled (on older OS versions in general but also) on the Raspberry Pi. I am using Raspbian 10 (buster) right now (you can check using cat /etc/os-release) and was able to fix this problem by updating the cmdline file like this:
sudo nano /boot/cmdline.txt
// add at the end of the line:
cgroup_enable=cpuset cgroup_enable=memory cgroup_memory=1
// save file

// will fully restart
sudo reboot

// check
docker stats
After adding these arguments from this very helpful Github issue and restarting docker info was now not showing any warnings anymore, docker stats was showing memory usage and my dashboards were starting to show container memory usage.

Cadvisor is eating my CPU
After now having all metrics available and data from a couple of days I pretty quickly noticed one alarming trend: the cadvisor container was using more CPU than all the containers it was monitoring combined. Not great for simple monitoring…
Fortunately I also found a fix for this, altough this really seems like something to be fixed by the developers. Beside switching to the newer (and I think still maintained) build zcube/cadvisor for the Raspberry Pi I also added a couple of commands to reduce CPU usage. Docker_only (restricts it to purely docker containers I think) and housekeeping_interval (minimal update interval for data about containers) did reduce the CPU usage by a lot. I also disabled some metrics I am not really using.
 cadvisor:
    image: zcube/cadvisor:latest # switched image
    container_name: cadvisor
    command:
      - "--docker_only=true"
      - "--housekeeping_interval=30s"
      - "--disable_metrics=accelerator,cpu_topology,disk,memory_numa,tcp,udp,percpu,sched,process,hugetlb,referenced_memory,resctrl,cpuset,advtcp"
# ...
Overall this leads to a much reduced CPU usage! From around 28% on the Pi 4 it went down first to 8% and then when I also excluded those metrics to around 4% now. Much better! While doing this I also switched the node exporter to prom/node-exporter but this had no visible impact.

This was also fixing some warnings I was seeing in the logs. Especially excluding hugetlb helped I think. My RAM usage has now also severely decreased, although the restart might have helped here. I will keep an eye on this!
I will definitely keep an eye on the server metrics but so far it has been very stable for me after those changes. I also like my updated dashboard. Check this out if you want to build your own dashboards too!