Stopping the annoying flood of errors from InfluxDB
InfluxDB (1.8) is a great database but it logs every web access as an error by default. This creates a lot of error entries in a log aggregation tool like Loki. There is a simple fix though.
Loki & log aggregation
Loki is a great tool to aggregate logs from a lot of sources in one place. I use it to collect the logs of all my Docker containers and show them all in Grafana. This works very well as they can even be integrated into the dashboards.
From each log a couple of datapoints are extracted. Right now those are mainly time, container name and source, which is the log level like INFO or ERROR. When I cleaned up my dashboard recently I noticed that I was seeing a lot of errors but most of them are from InfluxDB. I use influxDB to collect time series data and later display it in Grafana.
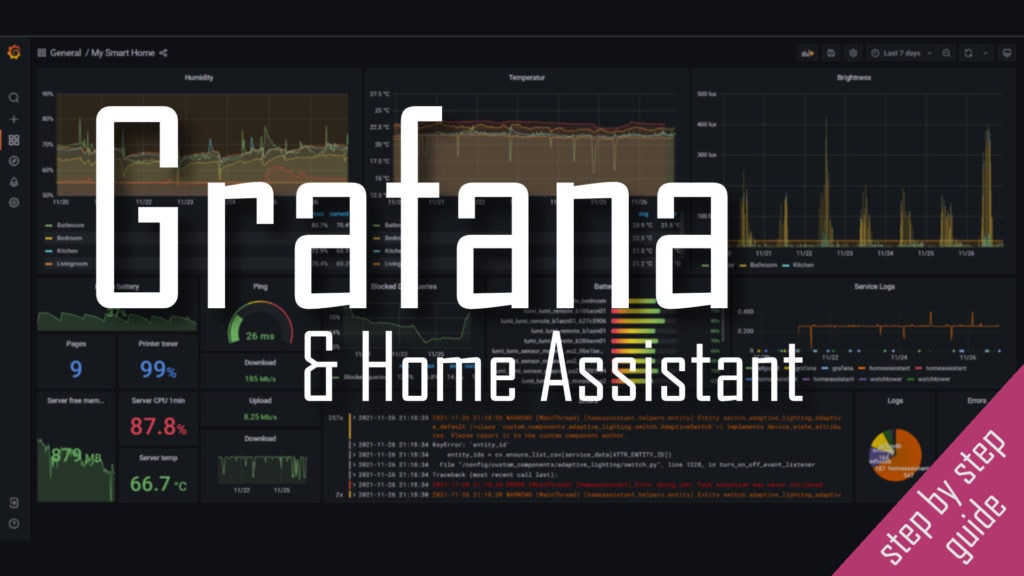
If you are looking for a full guide to quickly get up to speed in your smart home journey check out my Grafana & Home Assistant guide here!
It contains all the information you need to set up you own Grafana dashboards. It includes Images, code and a full step by step guide on how to use Grafana and integrate it with Home Assistant – for beautiful and functional dashboards!
Removing the errors from InfluxDB
InfluxDB (version 1.8) that I am using by default logs all access via the web API – and all of it as an error. I am really not sure why but this explains the many errors. Everytime Grafana requests data from InfluxDB this access is logged as an error.
Fortunately there is a simple fix if you do not need these logs. I personally do not need them as there is only one client: Grafana. These HTTP access logs can be disabled via the INFLUXDB_HTTP_LOG_ENABLED variable. If you use docker-compose like I am in my smart home server this can simply be done by adding a environment variable like:
influxdb:
    image: "influxdb:1.8"
    ...
    environment:
      - INFLUXDB_HTTP_LOG_ENABLED=false
    ...
Afterwards simply restart the container for this to take effect. Using docker-compose this can be done like docker-compose -f yourComposeFile.yaml up -d influxdb. That’s it, now I will only see actual errors in my log.