Scraping – How to track data from the web with Home Assistant and Grafana
Waiting times, prices or dates – any information that is freely available on the web can be collected by you with a process called scraping. With Home Assistant and Grafana I built a simple system to find out at what times of the week my gym has the fewest visitors – here is how to do that.
How to get information from the web
If you are looking for any information the chances are high that you can find a source on the Internet. In most cases even a free one. Some page is showing just the data you need. If you want to be able to track that over time or you are looking to include that data in a smart home automation then you need a way to get that data into Home Assistant. This way is an integration called “scrape”.
I am regularly going to some climbing gyms in my city. To have an easier time finding a spot to train and due to COVID I was looking looking for a time where the gym is quite empty. Fortunately they have a small widget on their website that is showing the current amount of people in the gym – making it public information that can be “downloaded”.
While looking for a simple solution to get this data I also stumbled about an interesting article where someone is checking TSA waiting times online for a vacation related home automation. They are using the same solution I am: the scrape integration. Scraping a website is the process of downloading it and extracting some information.
Before we start with that here is some background information about how the web works. If you open a website in your browser it will send a request to some server. That server will then answer (slightly simplified process here) with HTML code and CSS files. HTML describes the content and structure of the website in a computer readable format. The browser takes that and combines it with the CSS file(s) which describe how the elements on the page should look like. Then it renders the final page on your screen. You can view any of that code by opening the developer tools of your browser.

A scraper will download these same files and can then search through the HTML and extract the information you are looking for. This is pretty simple – you just need to find the right information. It gets a bit more complicated though with dynamic information.
For interactive or changing data the website will usually include JavaScript code in JS files. These are run by your browser and can load more information and manipulate the content of the page after the initial load. Scrapers usually do not run those files so that information is harder/impossible to extract. More on that later
The scrape integration in Home Assistant
Home Assistant comes with a built-in integration for extracting data from websites: the scrape integration. It does not support graphical configuration but it is easily set up via the configuration.yaml file. Here is the code I used to get the current number of visitors for my gym.
sensor:
  - platform: scrape
    resource: !secret gymURL
    name: Boulder gym people
    select: "div.status_text"
    scan_interval: 900
    value_template: >
      {{ value | regex_findall_index(find="\d+", index=0, ignorecase=true) | int}}
The goal of this sensor is to extract the current number of visitors from the home page. The page includes a short sentence with “x of y visitors” showing the current numbers.

The arguments for the scrape sensor are simple: the resource it the URL that contains the information. I have used a secret here to point to my secrets file but you can simply put a URL like “https://www.google.com” here. The select part tells the scraper where to look for the interesting information on the page. This is done by using CSS selectors. You can use a #id to select a certain id, use .class to select a class or just use div to select an element of that type.

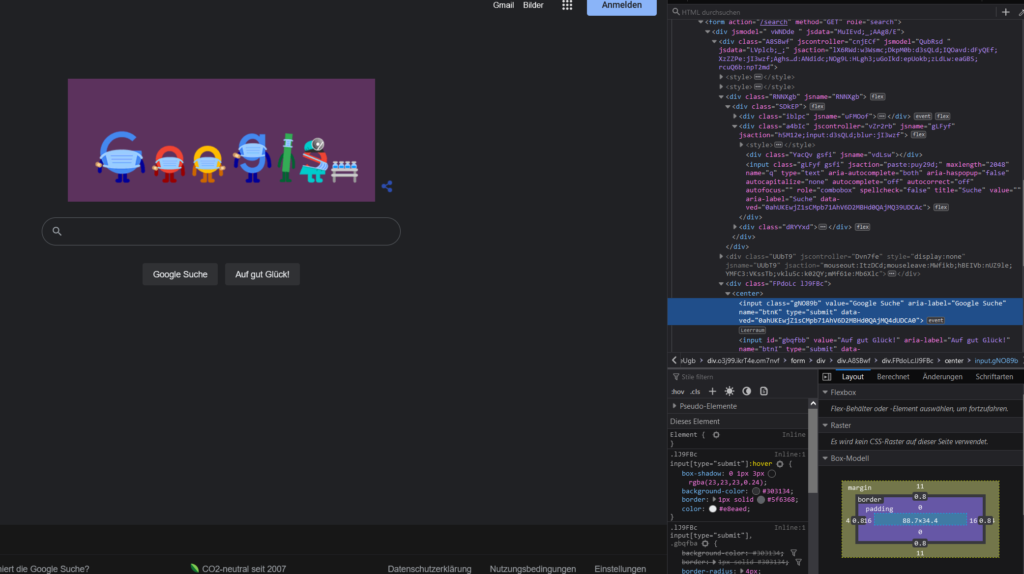
You can find out what selector to use by using the developer tools of the browser again. Usually your browsers right-click menu will have an option like examine that will open the developer tools with a focus on the current element. In my case you can see that the information is inside a <div> tag with the class status_text. Therefore a selector of div.status_text will look for all divs with the class status_text and return the “34 von 90 Besuchern” text. Make sure to make the selector specific enough to only return the needed information.
The last step to extracting that data is to get from this full sentence to just a number: 34. That is how many visitors are currently in the gym. That can be done via a value_template. This template takes the current value of the sensor, which is the full sentence for now, and uses a regular expression (a language for searching through text) to extract that number. \d+ looks for one number with one or more digits and extracts the first one found. Finally this text of “34” is converted into an actual number using the int pipe.
If you are not familiar with regular expressions, yet want to build your own there are powerful tools for that out there. Tools like ChatGPT might help (if they don’t make up stuff) or pages like this which include a nice reference, explanations and testing tools. I highly recommend using something like this to make sure your search expression actually works as intended.
Finally I also gave the sensor a name to be able to recognize it from the dashboard and set the scan_interval to update the value every 15 minutes (15 * 60 = 900 seconds). Make sure to set this value to avoid spamming a website. I would also advice to check if the website you are scraping allows this, otherwise they might start blocking your access at some point.
Scraping dynamic data
When trying to read the data this way I quickly ran into a problem… of seeing no data in Home Assistant. The problem is the Javascript code I mentioned earlier. It turns out the initial website (on loading it) does not contain this visitor data yet. Instead it contains some Javascript code that actively requests this data from another server and then injects it into the page. If you are missing any data be sure to check for a similar situation.
If you want to find out if any data is loaded from somewhere else you can again use the developer tools of your browser. Open them and find a tab called network analysis or similar. Now reload the page and you should see a list of all the requests your browser is making while loading the website.

It helps to filter for JS/XHR to exclude images and HTML/CSS/… code. If you see one request that is going to another host than the actual website title then that is most likely the call that loads the additional data. You can inspect details by clicking on the entry in the list.
In my case I was able to get the desired data by just requesting data from the same domain the website was calling on load. In short: a direct call to the website itself might not work for dynamic data but with a bit of luck you might be able to just direclty call the external API instead to get that data. Of course this only works if there are no additional security measures like usernames and passwords.
Using attributes as a data source
This scraping method is very flexible. In one case I wanted to get a percentage from a website that was only shown as a bar, never as a printed value. Fortunately you can also get any attribute of a HTML element. In this case the width of the bar was the current amount of people in the gym (in %).

A slightly modified scrape query can be used to get this data:
- platform: scrape
    resource: !secret gymURL2
    name: Boulder gym 2
    select: "div.bar"
    attribute: style
    scan_interval: 900
    value_template: >
      {{ value | regex_findall_index(find="\d+%", index=0, ignorecase=true) | regex_findall_index(find="\d+", index=0, ignorecase=true) | int}}
Again we are getting the data from a certain URL. Then we need to find the div with a bar class. Via the attribute: style setting we can tell the integration to look for the style attribute of this div. As seen in the screenshot the style contains the width in percent. The value_template contains two regex expressions this time. The first one finds the percentage, in this case “5%”, the second one then extracts the number “5” from that.
The | sign between the different steps is a so called pipe that takes the output from the last command and makes it the input of the next. It is basically chaining them together like a (surprise) pipe. In the end of the chain the value is turned into an actual number again by using the int function.
I am sure this can be done via one more complex regular expression but this is working quite well.
Displaying the data in Grafana
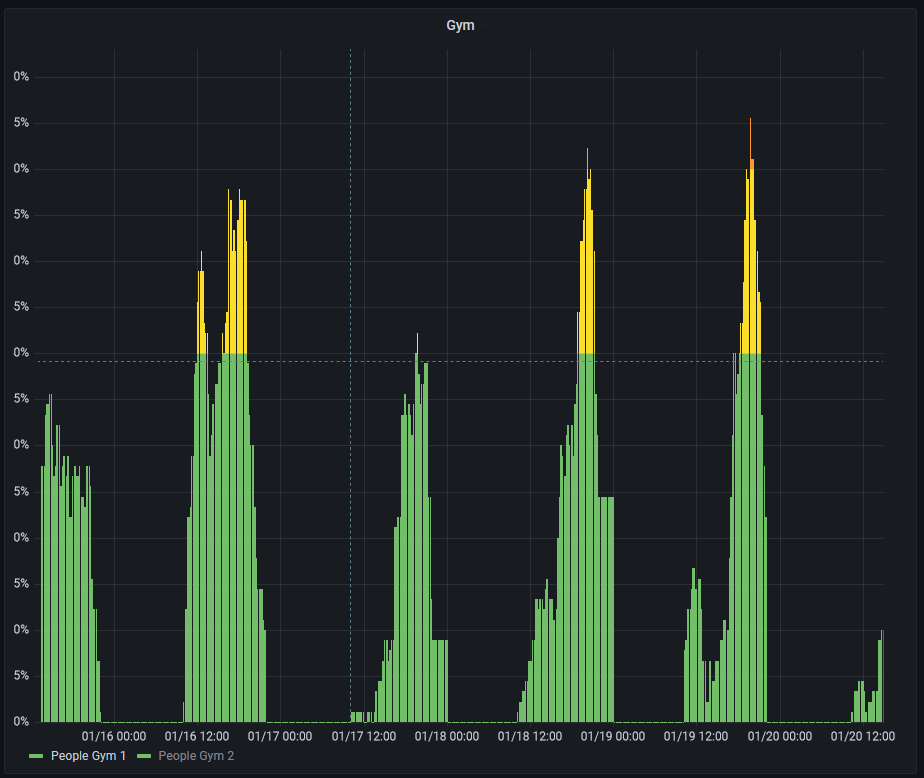
Once you have collected the data via Home Assistant you can also use it in Grafana if you have set up a connection via InfluxDB or similar. Of course any visualization works but I decided to go with a time series using bars.

The colors can be added by defining thresholds and then setting the “color scheme” to “From thresholds (by value)”. I have also set the unit to percent.
This visualization makes it very easy to see the peak times for each day (unsurprisingly its after work times during the week) and the different distribution over the days of the week (only during the weekend are people going to the gym early). You will also collect historical data you can use to figure out the best days to go.
I have shown some examples here and there are even more on the integration documentation but they all show that this integration can be a very powerful tool. Use it to get any data you need but please make sure to be a nice citizen of the web and avoid spamming any servers or “stealing” restricted data this way.


